Author: james Carter
Have we been too smart playing gold? Investing / trading in gold stocks over recent years, especially Newcrest Mining (NCM) and Regis Resources (RRL), has proven to be very profitable for Market Matters and its subscribers. However, we are currently bullish the precious metal over the next 1-2 years, but we are not long and local gold stocks continue to edge higher. We still feel the gold price has topped out in $US for the short term, but significant weakness in the $A since last month’s rate cut by the RBA, has sent the precious metal soaring in $A terms aiding the local producers – see chart Gold in both $A and $US Daily Chart
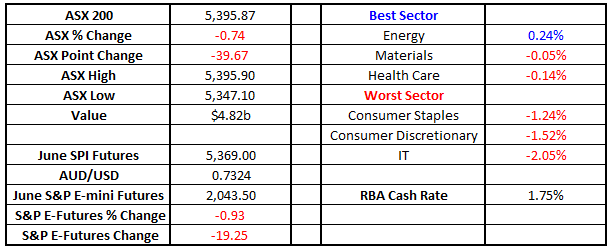
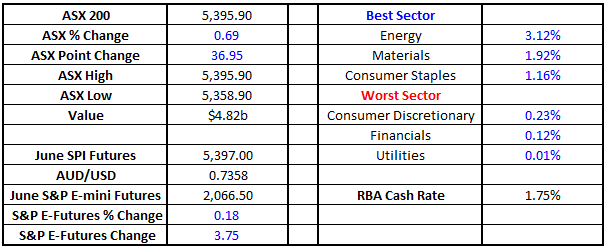
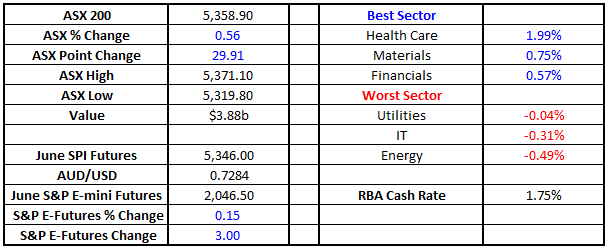
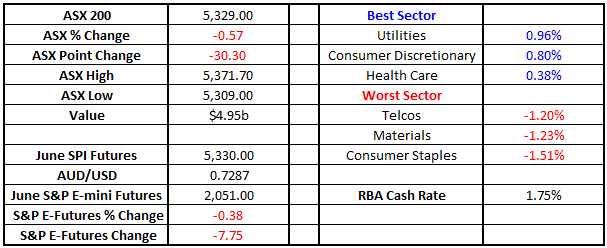
Australian 10-year bonds trading at an all time low yield There was plenty of news to consider discussing today from Warren Buffett investing $1bn into APPLE to oil trading at fresh highs for 2016 but its local interest rates that’s catching most investors attention. Yesterday Australian 10 year bonds traded at their lowest level in history reaching an amazing 2.2%. To put this into context, and thinking back to the booming 80’s this was bouncing between 12 and 14% – see chart 1. Investors should always remember the cyclical nature of markets when investing, taking on high leverage with rates at all time lows could prove very painful in years to come where a doubling in rates to ~4% would hardly register as a blip on the longer term road map Markets are now factoring in a 60% chance for two more rate cuts by early 2017 which equates to a significant 28% reduction in rates from the current official RBA rate of 1.75%. The most recent RBA minutes will be released today which will provide further insight into potential rate cuts for 2016/7. Equities have been enjoying this development on the rate front, since last month’s surprise cut, pushing up stocks with sustainable yield. Australian 10-year bond yield Monthly Chart
How can we be positive US equities at these levels? At the start of 2016 our forecast for US equities was a rally to fresh all-time highs followed by a significant correction. So far this year has produced some significant volatility but neither of our anticipated events have played out (as yet). We commenced the year with an aggressive 11.4% sell off, primarily on China concerns, which was then followed by an equally dynamic 16.6% rally to within 1.1% of last year’s all-time high. We still expect a final thrust for US equities, likely over the 2200 area, to complete a classic 5 phase bull market advance since the rally commenced in March 2009 – see chart 1. At this point in time we do not anticipate a 20-30% correction from US equities until we have experienced this “blow off top”. Market Matters will remain flexible around this view, just like we have since our previous January thoughts…..our best “guess” at present would be for a major high in early 2017 but this will be constantly updated in our daily reports. S&P500 Index Monthly Chart
Show more…
You need to be a member to view this article
REGISTER FOR FREE INSTANT ACCESS
Volumes fall, volatility rises can equal opportunity The Volatility Index (VIX) has risen marginally over the last few years and has proven very capable of spiking to extreme levels very quickly as we witnessed last year over China growth concerns – see chart 1. However volumes of the majority financial instruments have collapsed over the same period e.g. the volume of shares traded in the US has fallen 23% since the start of the year, the turnover of Treasuries has fallen back close to the depressed GFC levels and the average FX volume has dropped 20% over the last 18 months. Whether the fall off in activity is due to increased regulation since the GFC or investors nervousness with the current market / economies is open for debate but the resulting outcome is not. Lower volumes can be both exciting and dangerous as they lead to increases in short moves for stocks e.g. Fortescue has swung both up, and down, over 20% in a matter of weeks. Volatility (VIX) Index Weekly Chart
Really bullish, there's more to go in the reflation rally

Please enter your login details
Forgot password? Request a One Time Password or reset your password
One Time Password
Check your email for an email from [email protected]
Subject: Your OTP for Account Access
This email will have a code you can use as your One Time Password for instant access

To reset your password, enter your email address
A link to create a new password will be sent to the email address you have registered to your account.

Enter and confirm your new password

Congratulations your password has been reset

Sorry, but your key is expired.

Sorry, but your key is invalid.

Something go wrong.

Only available to Market Matters members
Hi, this is only available to members. Join today and access the latest views on the latest developments from a professional money manager.

Smart Phone App
Our Smart Phone App will give you access to much of our content and notifications. Download for free today.
