Aussie stocks start week on front foot
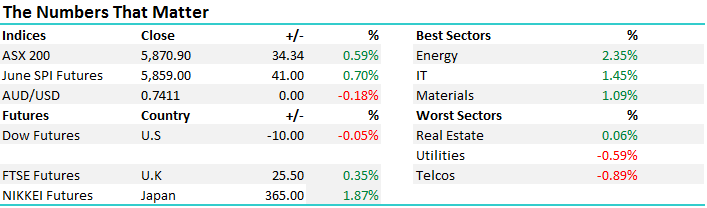
A decent session to kick off the week with clarity around the French election (no surprises) and a strong overseas lead, particularly in the material / resources / energy space had buyers out in force early on before the market trickled into the afternoon. Westpac delivered an ‘inline’ result on most metrics and put on +0.65% to close at $34.08 while ANZ went ex-dividend by 80c and dropped by 70c closing at $29.95.
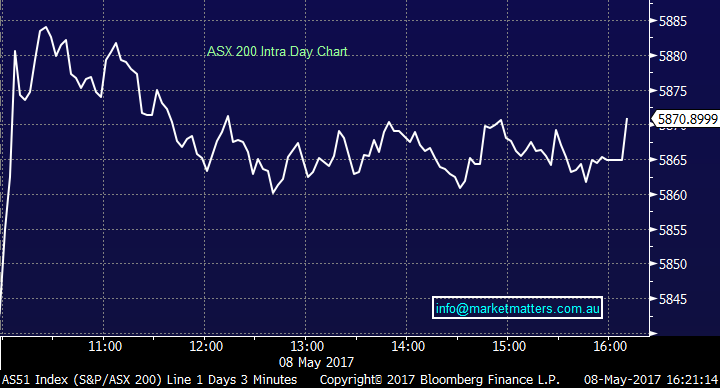
On the broader market today we had a range of +/- 41 points, a high of 5885, a low of 5844 and a close of 5871, up +34pts or +0.59%.
ASX 200 Intra-Day Chart
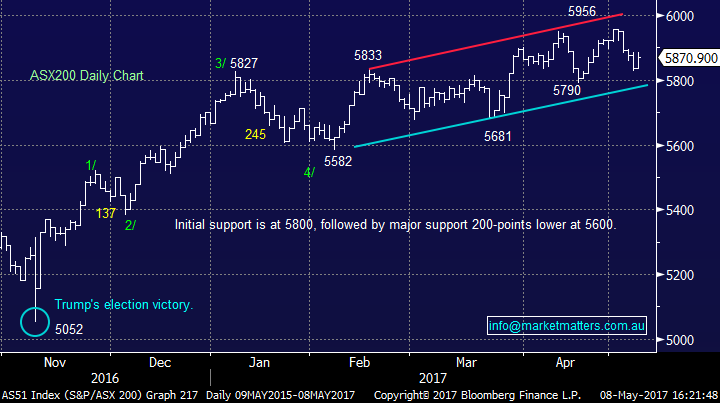
ASX 200 Daily Chart
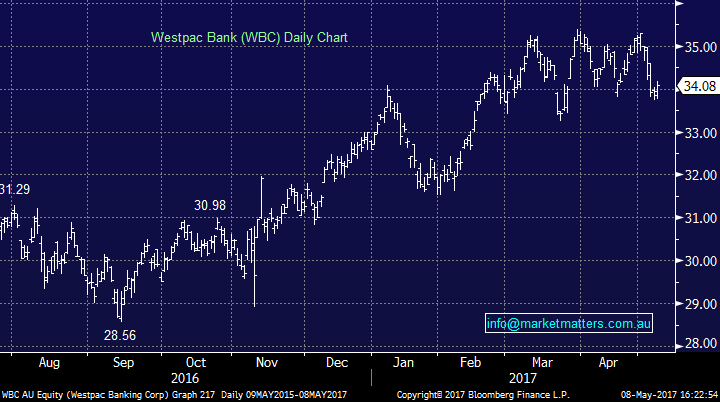
Westpac (WBC); No real surprises in the WBC result today with cash earnings coming smack in-line with expectations, the dividend of 94cps was in-line, Capital was slightly ahead at 10% v 9.6% expected and Net Interest Margin at 2.07% versus 2.10% consensus, however we saw a trend that is likely to continue in the banks for the foreseeable future. Top line revenue was a tad weak however they offset that by better discipline on costs and a better bad debt charge – so one could argue that the quality of the result was weak, but not concerning and certainly reflective of industry pressures.
The issue is the regulator (APRA) has been very forceful in curbing loan growth for investor loans + interest only lending so we’re likely to go into a period of low volume growth but expansion of margins as recent repricing has an impact. So, if we think about 3-4% loan growth plus margins expansion it’s easy to see 4%-5% revenue growth. If they continue to manage costs well as they have then 5% earnings growth is very achievable if bad debts stay well behaved.
Add to that a 5.5% dividend gets you a 10% return - OK in this type of mkt. The other interesting aspect specific to WBC is that loan re-pricing is largely focussed on investor and interest only loans and WBC have the biggest investor (42% book) and interest only (50% book) portfolios in the market, so will see most margin expansion.
Westpac (WBC) Daily Chart
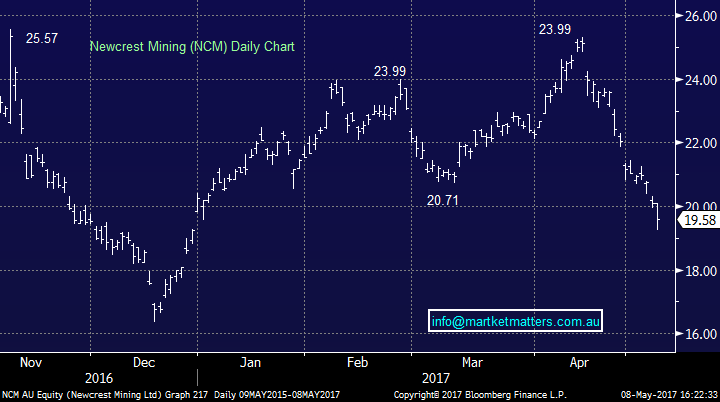
Newcrest (NCM); Hit today and was down -2.49% to close at $19.58 following a very bearish note from UBS on the stock. They have a SELL and $12.98 price target and are by far the most bearish in the market. That’s not a new thing for UBS having a sell on Newcrest, they’ve maintained that call from below $15 all the way to above $25. Consistency is good at least however they are outliers by a long way with the consensus target sitting at $22.08…
The yellow line tracks the evolution of their price target on the stock. We hold NCM and maintain comfortable in the position, given our overall portfolio stance.
Newcrest (NCM) Daily Chart
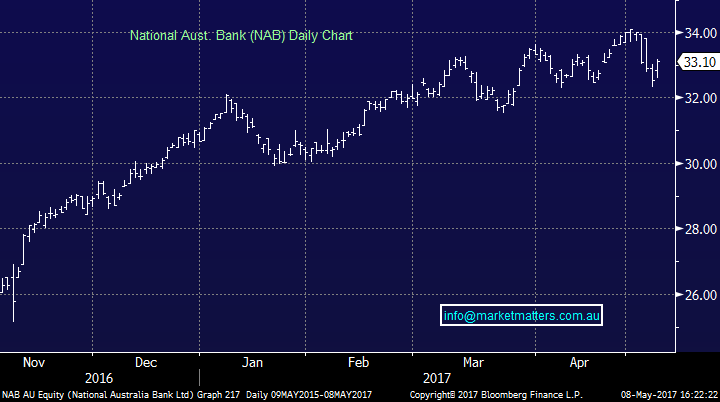
Our Moves; today we sold ANZ and increased our weighting to NAB. ANZ went down after we sold and NAB went up after we bought. This means very little on the day however the move has given us an increased cash position, now up to 33.5% and a reduced exposure to the banks, which we like. Flexibility into May / June continues to be important and cash increases that flexibility.
NAB Daily Chart
Have a great night,
The Market Matters Team
Disclosure
Market Matters may hold stocks mentioned in this report. Subscribers can view a full list of holdings on the website by clicking here. Positions are updated each Friday.
Disclaimer
All figures contained from sources believed to be accurate. Market Matters does not make any representation of warranty as to the accuracy of the figures and disclaims any liability resulting from any inaccuracy. Prices as at 08/05/2017. 5.10PM.
Reports and other documents published on this website and email (‘Reports’) are authored by Market Matters and the reports represent the views of Market Matters. The MarketMatters Report is based on technical analysis of companies, commodities and the market in general. Technical analysis focuses on interpreting charts and other data to determine what the market sentiment about a particular financial product is, or will be. Unlike fundamental analysis, it does not involve a detailed review of the company’s financial position.
The Reports contain general, as opposed to personal, advice. That means they are prepared for multiple distributions without consideration of your investment objectives, financial situation and needs (‘Personal Circumstances’). Accordingly, any advice given is not a recommendation that a particular course of action is suitable for you and the advice is therefore not to be acted on as investment advice. You must assess whether or not any advice is appropriate for your Personal Circumstances before making any investment decisions. You can either make this assessment yourself, or if you require a personal recommendation, you can seek the assistance of a financial advisor. Market Matters or its author(s) accepts no responsibility for any losses or damages resulting from decisions made from or because of information within this publication. Investing and trading in financial products are always risky, so you should do your own research before buying or selling a financial product.
The Reports are published by Market Matters in good faith based on the facts known to it at the time of their preparation and do not purport to contain all relevant information with respect to the financial products to which they relate. Although the Reports are based on information obtained from sources believed to be reliable, Market Matters does not make any representation or warranty that they are accurate, complete or up to date and Market Matters accepts no obligation to correct or update the information or opinions in the Reports.
If you rely on a Report, you do so at your own risk. Any projections are estimates only and may not be realised in the future. Except to the extent that liability under any law cannot be excluded, Market Matters disclaims liability for all loss or damage arising as a result of any opinion, advice, recommendation, representation or information expressly or impliedly published in or in relation to this report notwithstanding any error or omission including negligence.
To unsubscribe. Click Here


