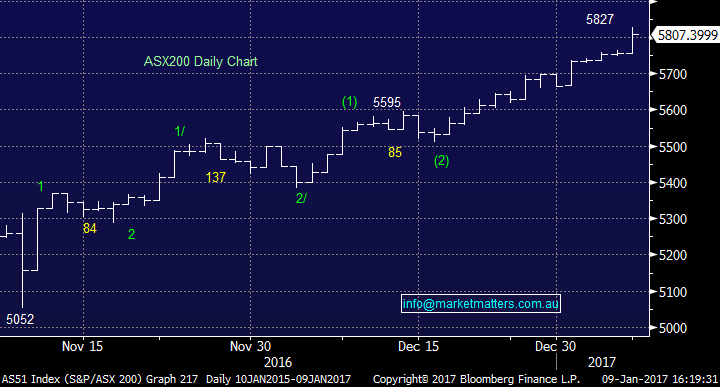
Aussie market breaks through 5800!
What Mattered Today
Happy New Year to all – the first day back for many of the MM team and the market once again tracked higher – hitting its highest close since early 2015, adhering to the strong seasonal strength at the end of Dec / early Jan that we’ve been highlighting throughout the period. We’ve been reasonably active over the Christmas break taking the opportunity to increase cash levels into strength, which is clearly going against the grain at the moment. Our manta for Q1 continues to be SELL strength and BUY weakness given we expect a fairly choppy path for the market before an eventual major top plays out later in the year.
We’ll be releasing a full outlook piece to subscribers mid-month setting out or roadmap for the year ahead, however we continue to believe that 2017 will be an exciting but potentially very dangerous year for investors. Some major trend changes will play out with an overlay of continued political disruption. The Trump ‘honeymoon’ will come to an end at some point, Europe will continue to flirt with likely structural changes while rising global interest rates will at some stage put pressure on stock prices, and likely cause money to be pulled out of emerging markets. These are well known and understood themes so they’re less likely to cause a meltdown however they should be kept in the back of our minds when the media / commentators / advisers are pushing the bullish rhetoric which happens when markets are near a peak .
We’ll continue to be more active around our portfolio – selling strength, increasing cash when we can and re-deploying during bouts of weakness. To be clear – the playbook remains.
- Short-term - a 80-90 point pullback is due and currently we will reserve general buying until this unfolds.
- Medium Term - we can see a rally over 6000 which is now under 5% away.
- Longer term - in a similar vein to the US we anticipate weakness back under the psychological 5000 area.
If we think about the ASX at current levels, it’s clearly expensive compared to trailing earnings – on a PE of around 18 times which is very rich. A high multiple isn’t necessarily a bad thing if earnings growth materialises, which it is at the moment, however the bulk of it is coming from the material space – the resource companies have been begrudgingly upgraded driving EPS revisions for the broader market. We say begrudgingly because analysts have gotten commodity price forecasts wrong, so they’re behind the curve and more or less chase their tales BUT as we’ve written at the back end of last year, commodity prices have started to roll over. If they continue to fall then EPS growth stalls, the market starts to look expensive on forward numbers and it comes under pressure.
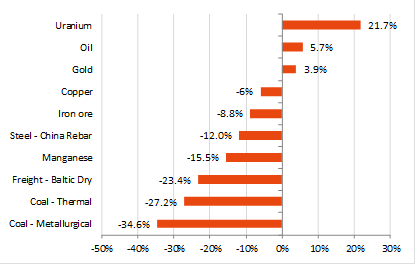
This is a chart from Shaw and Partners about price action since the mid Dec highs…clearly some selling coming into underlying commodities which has started to filter into stocks
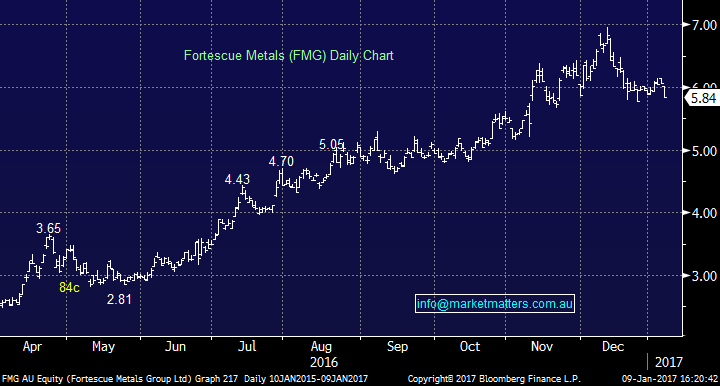
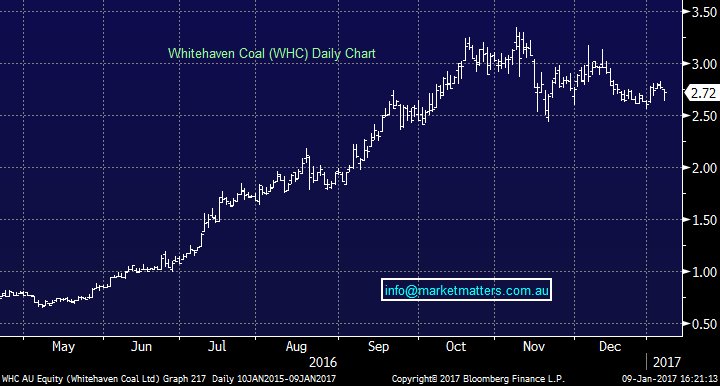
Fortescue & Whitehaven Coal two good examples of leveraged commodity plays that can be used as a barometer for the wider sector…
Fortescue Metals (FMG) Daily Chart
Whitehaven Coal (WHC) Daily Chart
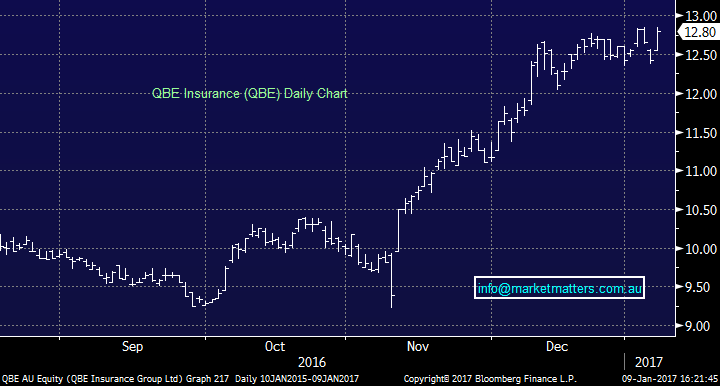
That said, there are pockets of the market that still look good. Healthcare was up today courtesy of strong buying in Healthscope and Ramsay – we continue to hold healthcare in our portfolio. QBE continues to look appealing particularly given the stock’s performance last week as bond yields + the $US pulled back – two things that should have prompted a decent flow of money out of the stock but it didn’t. A stock that stays supported on bad news suggests strength and the risk in QBE is clearly to the upside. The US employment picture is supportive, particularly the growth in wages as it will be inflationary - overlay that with higher commodity prices, particularly Oil in addition to Trumps’ stimulatory policies and you could make a strong argument that US interest rates will go higher than many think this year! If we’re having a stab at what will prompt our expected correction for equities at some point this year, interest rates are currently odds on.
QBE Insurance (QBE) Daily Chart
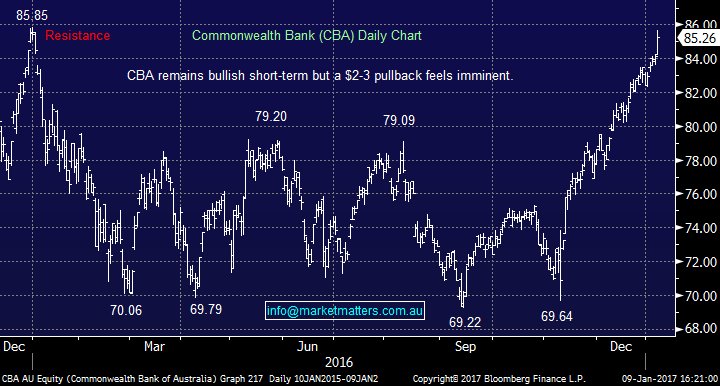
Elsewhere, banks had a great day with CBA cracking through $85 to close at $85.26 – a rise of +1.34%. Higher rates are supportive of bank earnings + reduced capital levels will also help BUT it seems to us that we’re approaching a point where that is now priced into the market. At $70, CBA was on the nose and there was a bucket of reasons to stay away, now banks are in vogue again. Ad to in pullbacks but once again, reduce into strength.
Commonwealth Bank (CBA) Daily Chart
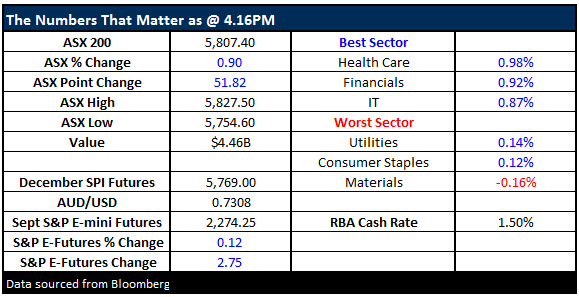
On our market today we had a range of +/- 73 points, a high of 5827, a low of 5743 and a close of 5807, up +51pts or +0.90%. Volume was better as more participants come back from holidays – Sydney traffic has certainly started to pick up again!
ASX 200 Daily Chart
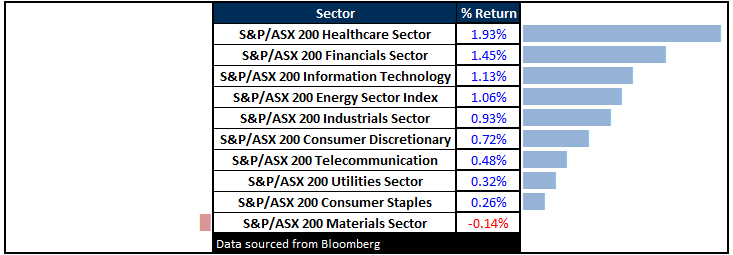
Sectors
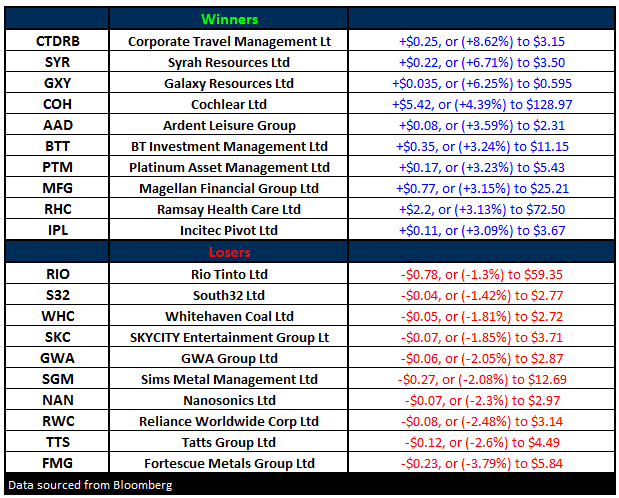
Healthscope and Ramsay copped some buying today – so did CSL which closed at $104. Resource stocks the only drag
ASX 200 Movers
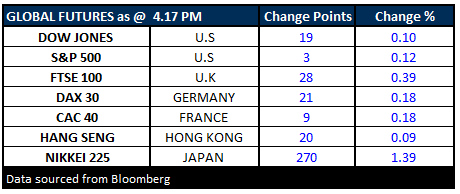
What Matters Overseas
Disclosure
Market Matters may hold stocks mentioned in this report. Subscribers can view a full list of holdings on the website by clicking here. Positions are updated each Friday.
Disclaimer
All figures contained from sources believed to be accurate. Market Matters does not make any representation of warranty as to the accuracy of the figures and disclaims any liability resulting from any inaccuracy. Prices as at 09/01/2017. 5.00PM.
Reports and other documents published on this website and email (‘Reports’) are authored by Market Matters and the reports represent the views of Market Matters. The MarketMatters Report is based on technical analysis of companies, commodities and the market in general. Technical analysis focuses on interpreting charts and other data to determine what the market sentiment about a particular financial product is, or will be. Unlike fundamental analysis, it does not involve a detailed review of the company’s financial position.
The Reports contain general, as opposed to personal, advice. That means they are prepared for multiple distributions without consideration of your investment objectives, financial situation and needs (‘Personal Circumstances’). Accordingly, any advice given is not a recommendation that a particular course of action is suitable for you and the advice is therefore not to be acted on as investment advice. You must assess whether or not any advice is appropriate for your Personal Circumstances before making any investment decisions. You can either make this assessment yourself, or if you require a personal recommendation, you can seek the assistance of a financial advisor. Market Matters or its author(s) accepts no responsibility for any losses or damages resulting from decisions made from or because of information within this publication. Investing and trading in financial products are always risky, so you should do your own research before buying or selling a financial product.
The Reports are published by Market Matters in good faith based on the facts known to it at the time of their preparation and do not purport to contain all relevant information with respect to the financial products to which they relate. Although the Reports are based on information obtained from sources believed to be reliable, Market Matters does not make any representation or warranty that they are accurate, complete or up to date and Market Matters accepts no obligation to correct or update the information or opinions in the Reports.
If you rely on a Report, you do so at your own risk. Any projections are estimates only and may not be realised in the future. Except to the extent that liability under any law cannot be excluded, Market Matters disclaims liability for all loss or damage arising as a result of any opinion, advice, recommendation, representation or information expressly or impliedly published in or in relation to this report notwithstanding any error or omission including negligence.
To unsubscribe. Click Here


