Are bank dividends sustainable?
Stock
ANZ Banking Group (ANZ) Commonwealth Bank (CBA) National Australia Bank (NAB) Westpac Banking Group (WBC)Event
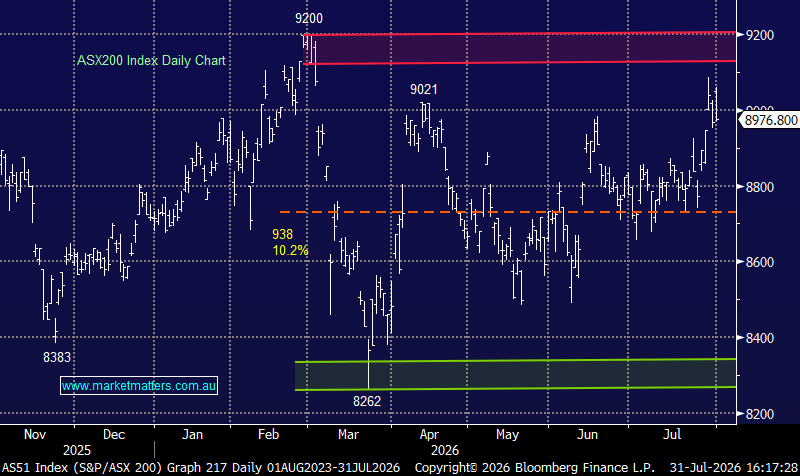
Looking at the ASX 200 banking index relative to the ASX 200, we see some significant underperformance which as the below chart highlights is reasonably rare – normally the banking sector and the market have a high correlation over time. This is generally because banks are bell weathers for broader economic trends (corporates doing well – banks do well) and also a function of their index dominance. So, has the market run too hot or has the outlook for banks deteriorated meaningfully? Relative Performance - Australian Banking Sector v ASX 200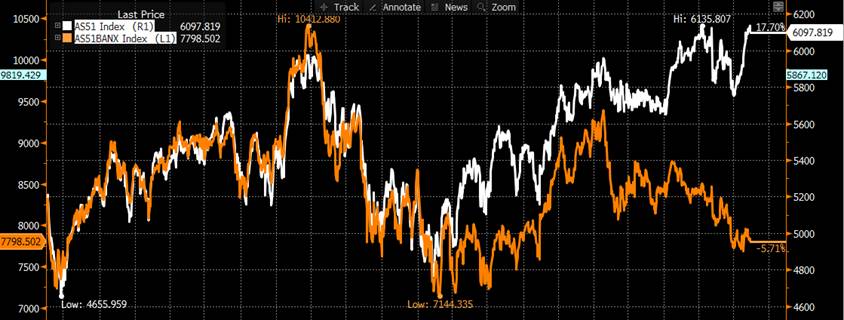 Prices based on market close 15/05/2018
We often talk about yield providing likely support for bank share prices even with the vortex of negativity playing out. However, if we have that view as we do, we need to have confidence that dividends will continue to be paid at / around current levels into the future.
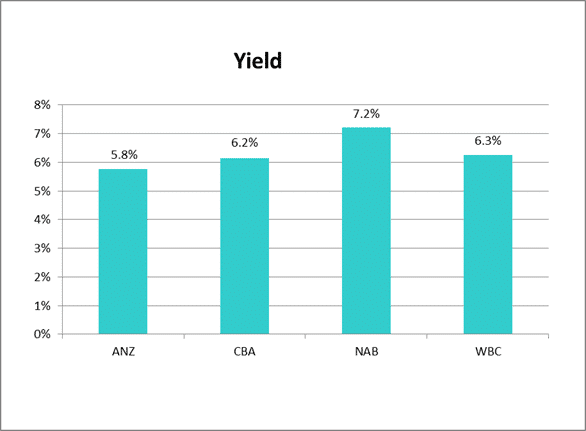
Current dividend yields (excluding franking) – clearly attractive.
Prices based on market close 15/05/2018
We often talk about yield providing likely support for bank share prices even with the vortex of negativity playing out. However, if we have that view as we do, we need to have confidence that dividends will continue to be paid at / around current levels into the future.
Current dividend yields (excluding franking) – clearly attractive.
 From a sector perspective (which includes the second tier players as well), the current projected yield is 6.26%. Historically, banking shares tend to peak at a yield around 5% and base out on a yield around 7% with most time spent around the 5.5% mark. From the chart below yields are attractive, but we have seen periods where they’ve been better i.e. 7%+
ASX 200 Bank Sector Dividend Yield
From a sector perspective (which includes the second tier players as well), the current projected yield is 6.26%. Historically, banking shares tend to peak at a yield around 5% and base out on a yield around 7% with most time spent around the 5.5% mark. From the chart below yields are attractive, but we have seen periods where they’ve been better i.e. 7%+
ASX 200 Bank Sector Dividend Yield
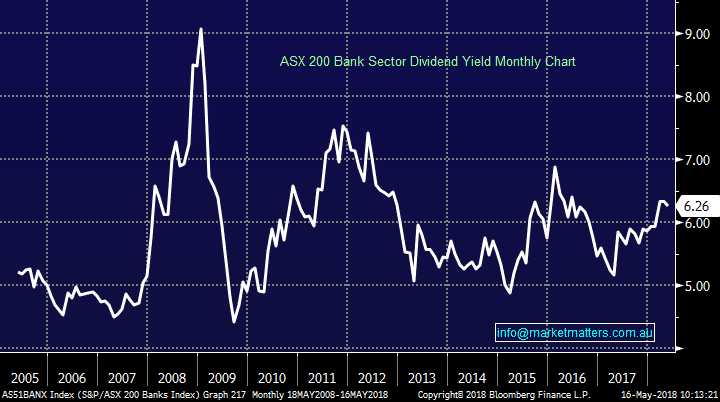 As shown in the chart above, there can be some significant variance in the prevailing yield of the banking sector, which is obviously a function of volatility in underlying share prices. When share prices are low, yields are high and vice versa.
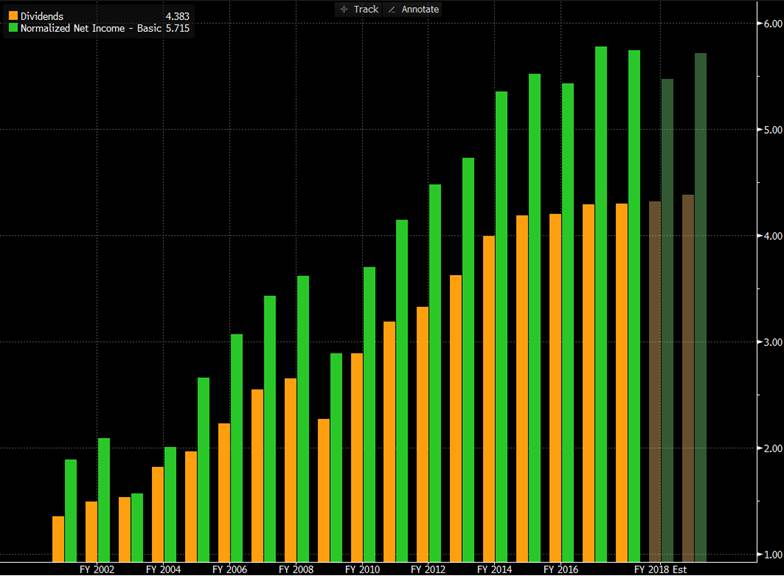
However, when considering the actual profile of dividends for say Commonwealth Bank (CBA) over the years, dividends (and earnings for that matter) have been very consistent – the GFC being the obvious exception which hit 2009 earnings and dividends. In 2008 CBA did $3.61 per share in earnings and paid $2.65 in dividends – reflecting about a 73% payout of earnings. During the GFC, earnings dropped to $3.27 per share - a ~9% drop on the prior year. At that time they also reduced the dividend to $2.27 which is a 14% decline on a 69% payout ratio. Clearly, CBA took the prudent course of action to retain more earnings given the huge uncertainty created by the crisis.
CBA dividends (yellow) and earnings (green) going back to 2001.
As shown in the chart above, there can be some significant variance in the prevailing yield of the banking sector, which is obviously a function of volatility in underlying share prices. When share prices are low, yields are high and vice versa.
However, when considering the actual profile of dividends for say Commonwealth Bank (CBA) over the years, dividends (and earnings for that matter) have been very consistent – the GFC being the obvious exception which hit 2009 earnings and dividends. In 2008 CBA did $3.61 per share in earnings and paid $2.65 in dividends – reflecting about a 73% payout of earnings. During the GFC, earnings dropped to $3.27 per share - a ~9% drop on the prior year. At that time they also reduced the dividend to $2.27 which is a 14% decline on a 69% payout ratio. Clearly, CBA took the prudent course of action to retain more earnings given the huge uncertainty created by the crisis.
CBA dividends (yellow) and earnings (green) going back to 2001.
Current Market Outlook
Fast forward to today in an environment where the market is incredibly negative the banks. Determining whether or not dividends are sustainable depends on a few factors, and it depends if we’re talking about sustainable payout ratios or sustainability of the dividend in absolute dollar terms. If we think sustainability of payout ratios then it’s a more complex discussion. If we dumb it down, banks lend money at a higher rate than they borrow it and that generates a profit. However, for every dollar a bank lends it is obliged (by the regulator) to hold capital against it – in rough terms somewhere around 7c for every $1 lent. If a bank lends more, they need to hold more capital while the flip side is also true, lower lending = lower capital. Assuming the bank is growing, it needs to retain some profits to support its capital requirements i.e. not pay all out as dividends to shareholders. For those that like the math, a company’s sustainable growth rate is a function of its return on equity and the percentage of those profits that are ploughed back into the bank – calculated as ROE x (1 - dividend-payout ratio). For example, CBA has return on equity of 15% and a payout ratio of 75%, its sustainable growth rate is calculated by taking 0.15 and multiplying it by (1 - 0.75), giving it a sustainable growth rate of 3.75%. You can do these calculations for all the banks. (ANZ has ROE of 13%, NAB does 12%, WBC 13%, BOQ 9.5% and BEN 8.5%). So CBA can grow its loan book at 3.75% and generate enough capital organically to maintain a 75% payout ratio. 3 of the big 4 banks have just reported while CBA gave a trading update. Post these results, the market is now pricing in around 4% loan growth for the sector. If this plays out, then banks can sustain a payout ratio of 80%. Looking at ANZ and CBA below, given current growth and dividend payouts they have room to move and can be more aggressive in growing above system. NAB and Westpac are stretched, and will struggle to grow lending and maintain current payout ratios. So although NAB looks most attractive from a yield perspective now, if we assume NAB and WBC grow in line with the sector they will clearly struggle to maintain their current payout, the offset of course being that they currently have higher dividend rates as a cushion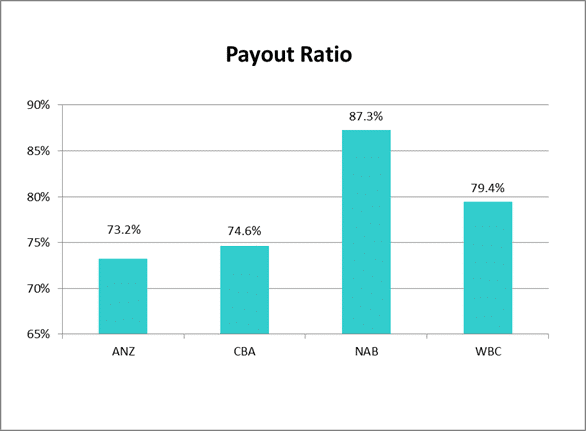
Loans and Growth
The real concern though is around loan growth and whether or not we see a big deterioration here. I have written about the end of a multiple decade long bear market in interest rates, meaning interest rates are about to start trending higher over time – a big shift versus the trends of the last 30 years. This could theoretically have a large negative influence on credit growth all over the economy, including housing which has been the most consistent sector for decades.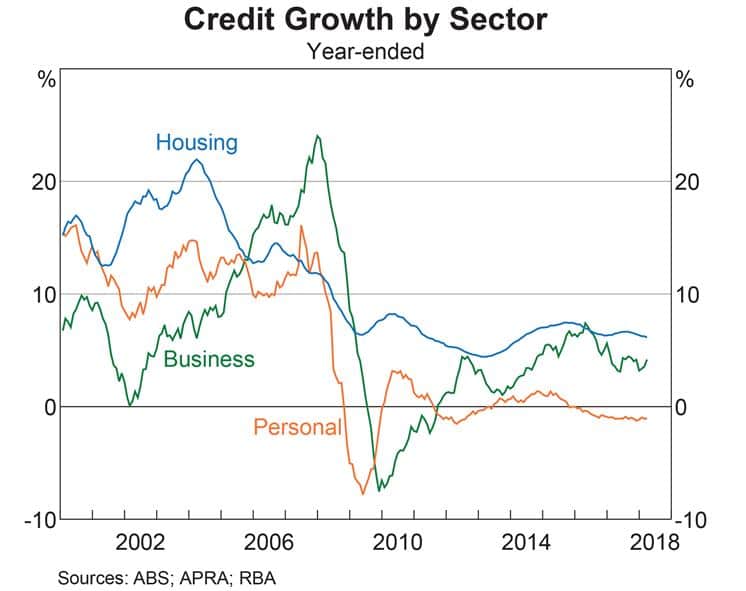 Like all pundits, we simply don’t know if we’ll see a big decline in credit. The last time we saw this was during the GFC and that resulted in a 9% drop in CBA earnings and a 14% drop in their dividend remembering that declining loan growth arguably puts less pressure on the actual dividend payout ratio. (although the earnings component to the equation will also be impacted negatively).
Market Matters Take/Outlook
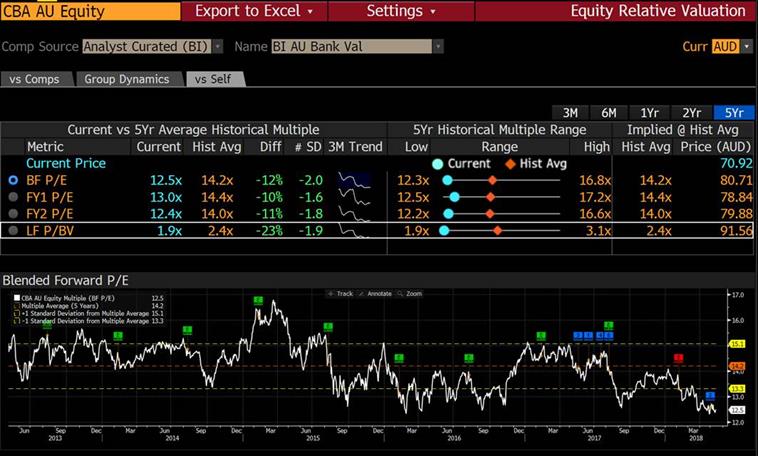
On balance (and using history as a guide), the dividends of CBA and ANZ look safe, followed by Westpac and finally NAB. NAB is unlikely to increase its dividend for many years and clearly they have less buffer or more chance of cutting it if economic conditions deteriorate. Deteriorating economic conditions will lead to higher bad debts which again will impact NAB the most. From a valuation perspective the sector does look attractive and dividends on the whole do appear sustainable, however the clear risk is that economic conditions do turn creating a headwind for the revenue side. This is a low probability outcome though and we’re not seeing indications of this now. Within the sector, CBA is our preferred pick. The traditional peer premium CBA usually trades at (12%) has evaporated. That premium that has played out over time is a direct consequence of CBA being a better run organisation. According to the media this is no longer the case, however there’s more to it than perception. CBA has had better internal metrics like a far superior return on equity (15% ROE v a sector on 12%) for many years. There’s a host of reasons for it, with the majority remaining intact. Despite the recent headwinds, personnel changes, hit to brand etc., CBA generates better returns and in our view should continue to justify a sector premium. CBA versus the sector – red expensive, green cheap.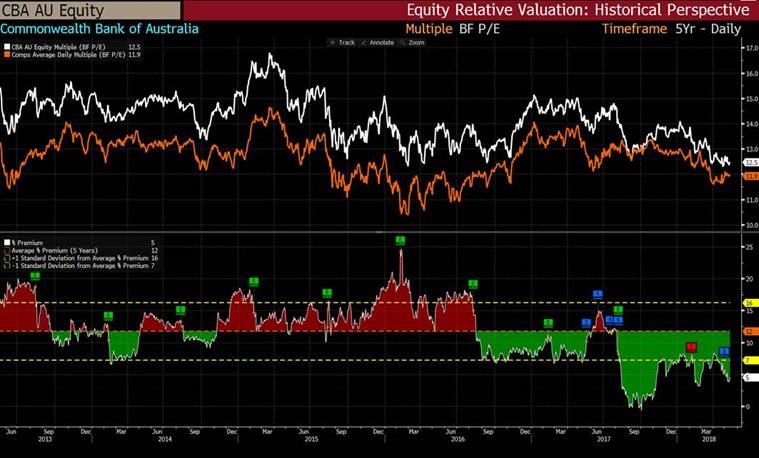 Over the last 5 years, CBA has traded between a PE of 12.3x and 16.8x – today CBA is trading on 12.5x. The most recent time CBA traded at this valuation (Sep 2017) it subsequently rallied ~20% on 5 months.
CBA – valuation dynamics vs last 5 years
Over the last 5 years, CBA has traded between a PE of 12.3x and 16.8x – today CBA is trading on 12.5x. The most recent time CBA traded at this valuation (Sep 2017) it subsequently rallied ~20% on 5 months.
CBA – valuation dynamics vs last 5 years