ANZ reports, RBA holds fire and Woolies trumps Coles…
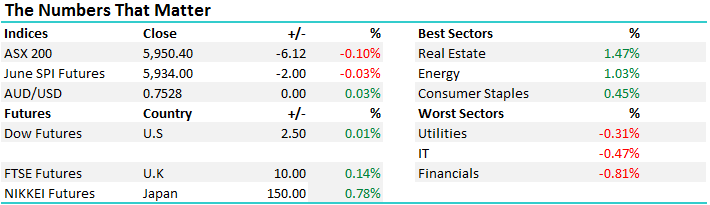
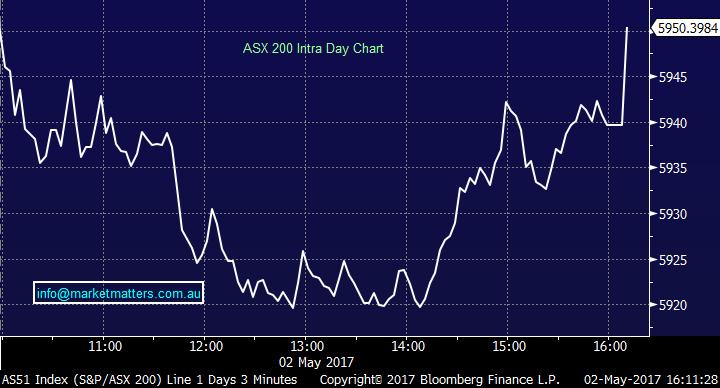
An interesting day on a few fronts with a number of major corporate updates, another month of inactivity by the RBA on interest rates and a weaker than expected Manufacturing print from China which saw resource stocks give back early gains. All in all, the market was softer however the range was reasonable and late buying saw the index run up around 30pts from the daily lows. We had a range today of +/- 37 points, a high of 5956, a low of 5919 and a close of 5950, off -6pts or -0.10%.
ASX 200 Intra-Day Chart
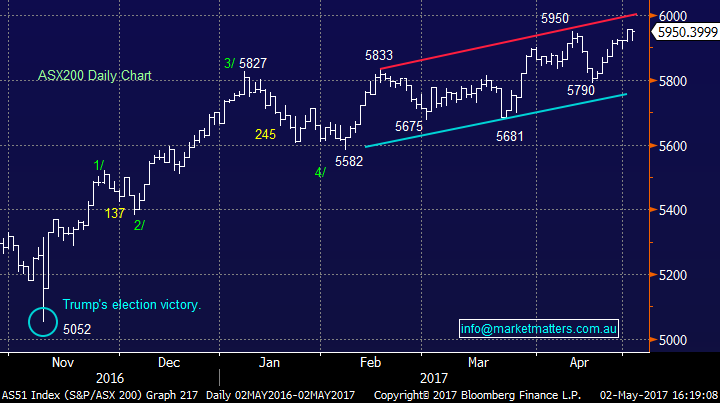
ASX 200 Daily Chart
ANZ; A messy result from ANZ this morning however it was always going to be with the divestment of a number of their Asian operations and some one-offs making the result hard to decipher initially. Stripping out all the noise, EPS was a tad soft, missing expectations by about 3% while the dividend was inline (80cps) and capital was ahead with CET 1 at 10.1% - which is sector leading and a beat.
The earnings were also supported partially by a lower bad debt change (which is a boost) however a low quality one while net interest margins were 2% - down 6bps and below market expectations.
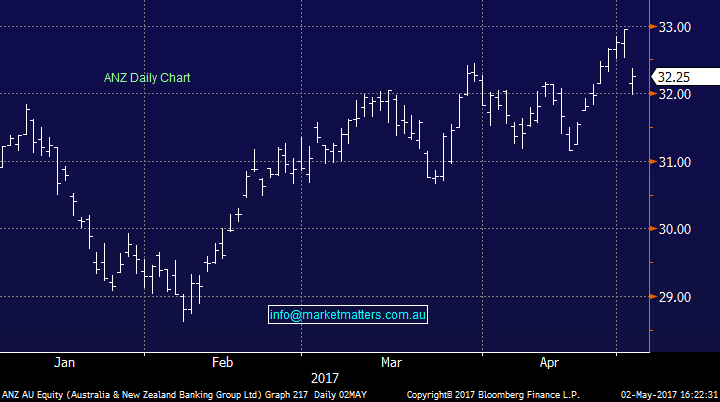
All up, a slightly weaker result than the market was positioned for + the share price had run hard leading into it, hence profit taking today saw the stock down 2.12% to close at $32.25. A few questions filtering through around our stance post the results and nothing has really changed. We own ANZ, we want the dividend and we don’t think weakness will be too severe, we also decreased sector exposure by selling CBA on Friday, and have decent cash at 29% - all up we’re happy with the positioning around the stock at this juncture.
ANZ Bank (ANZ) Daily Chart
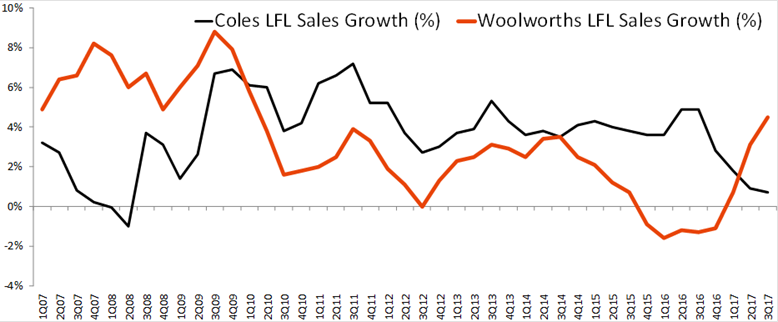
Woolies (WOW); The 3rd straight quarter of like for like (LFL) sales growth in the Supermarkets division was a good result from Woolies today and builds on the recent strong quarters(1Q17 +0.7%, 2Q17 +3.1% and now 3Q17 +4.5% Easter adjusted). A lot of noise around weakness in Big W, some swings and roundabouts in terms of the Liquor division, however most attention should squarely be put on the food business (62% of group earnings) and the pace it is growing sales relative to Coles.
Coles reported +0.7% LFL sales growth last week and it’s fairly clear that Woolies has gained the upper hand. No doubt a good result and above market expectations however the low hanging fruit is the easiest to pick. As they describe it, they’ve invested heavily in the customer which simply means they’ve lowered prices and are now cheaper than Cole. Obviously this gives them a top line benefit however it’s offset by lower margins. They had to do something to defend market share, particularly given increasing competition locally (and from new entrants), however it will get tougher from here.
Like for Like Sales Growth – Coles versus Woolies
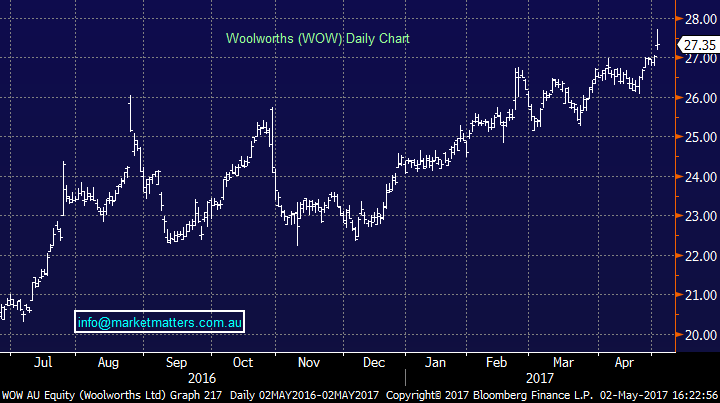
In terms of price action today, the good result was clearly expected and investors were positioned for it. We’re neutral at best on Woolies at this juncture
Woolworth (WOW) Daily Chart
The RBA & Interest Rates; No change to rates which was expected however we saw some slight weakness in the Aussie Dollar afterwards on more dovish commentary. As it stands, the market is effectively pricing ‘no change’ to rates for the next 12 months with some softness in the labour market offset by strength in the housing market – or at least that is what they say. What actually seems to be happening is that the RBA has recognised that rate hikes / cuts in official terms is a blunt object and is not suitable to current conditions. Instead, a more targeted approach (from the banks themselves following APRA pressure) targeting specific areas of lending like investor loans. A smart approach really!
Aussie Dollar Intra Day Chart

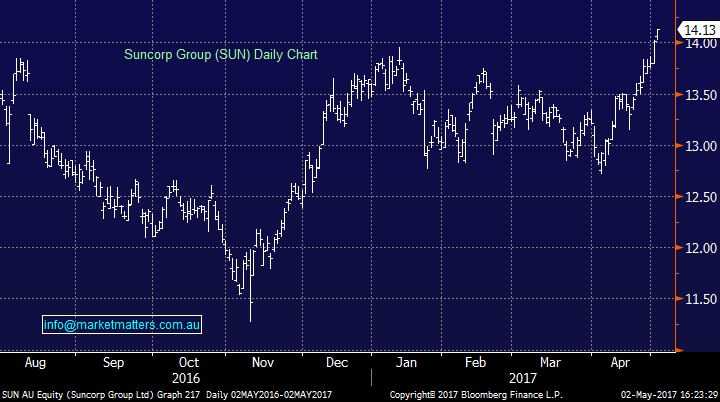
Elsewhere, a couple of charts that caught our attention today where Suncorp (SUN) and Macquarie (MQG). The Insurance sector is our most concentrated (bullish) bet in the MM Portfolio right now and Suncorp in particularly looks very bullish here. Suncorp remains our largest holding accounting for 12% of the portfolio.
Suncorp (SUN) Daily Chart
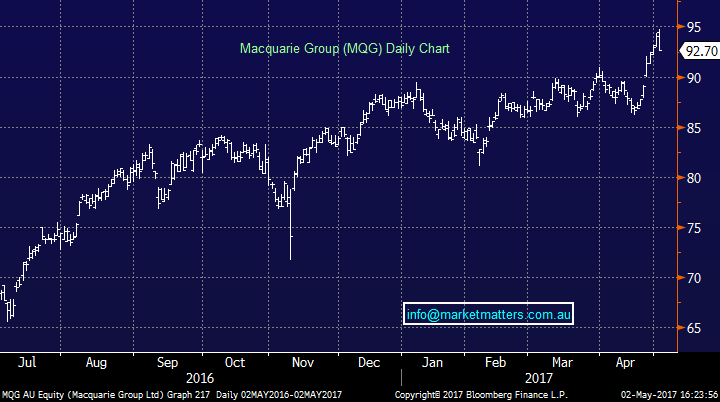
Macquarie on the other hand looks bearish from a short term perspective today, pushing to new highs before reversing sharply. MQG reports on Friday.
Macquarie (MQG) Daily Chart
Have a great night,
The Market Matters Team
Disclosure
Market Matters may hold stocks mentioned in this report. Subscribers can view a full list of holdings on the website by clicking here. Positions are updated each Friday.
Disclaimer
All figures contained from sources believed to be accurate. Market Matters does not make any representation of warranty as to the accuracy of the figures and disclaims any liability resulting from any inaccuracy. Prices as at 02/05/2017. 4.38PM.
Reports and other documents published on this website and email (‘Reports’) are authored by Market Matters and the reports represent the views of Market Matters. The MarketMatters Report is based on technical analysis of companies, commodities and the market in general. Technical analysis focuses on interpreting charts and other data to determine what the market sentiment about a particular financial product is, or will be. Unlike fundamental analysis, it does not involve a detailed review of the company’s financial position.
The Reports contain general, as opposed to personal, advice. That means they are prepared for multiple distributions without consideration of your investment objectives, financial situation and needs (‘Personal Circumstances’). Accordingly, any advice given is not a recommendation that a particular course of action is suitable for you and the advice is therefore not to be acted on as investment advice. You must assess whether or not any advice is appropriate for your Personal Circumstances before making any investment decisions. You can either make this assessment yourself, or if you require a personal recommendation, you can seek the assistance of a financial advisor. Market Matters or its author(s) accepts no responsibility for any losses or damages resulting from decisions made from or because of information within this publication. Investing and trading in financial products are always risky, so you should do your own research before buying or selling a financial product.
The Reports are published by Market Matters in good faith based on the facts known to it at the time of their preparation and do not purport to contain all relevant information with respect to the financial products to which they relate. Although the Reports are based on information obtained from sources believed to be reliable, Market Matters does not make any representation or warranty that they are accurate, complete or up to date and Market Matters accepts no obligation to correct or update the information or opinions in the Reports.
If you rely on a Report, you do so at your own risk. Any projections are estimates only and may not be realised in the future. Except to the extent that liability under any law cannot be excluded, Market Matters disclaims liability for all loss or damage arising as a result of any opinion, advice, recommendation, representation or information expressly or impliedly published in or in relation to this report notwithstanding any error or omission including negligence.
To unsubscribe. Click Here


