A look at market statistics, putting this market into context!
When equity markets get hit, as they have done in the last month or so, we get the inevitable bears gaining most airtime. They’re usually the bond guys who promote ‘somewhere to hide’ during turbulent times. We’ve often written about market corrections calling a 20% pullback at some stage which attracted attention, pushback from some but it’s not a huge call, nor does it mean the end of making money from stocks. Corrections of that magnitude happen every few years, they’re a normal part of the market. Right now the ASX 200 has fallen from the peak of 6373 on the 30th August to the low on the 21st November of 5594, a drop of -779 points or -12.22% . Today we’ll look more at market data, facts rather than opinion to provide a backdrop for where markets currently sit. It can often be worthwhile to sit back and think about the market in more general terms and today we’ll look at market performance over time, earnings and dividend expectations and what the market is pricing around interest rates.
Market performance
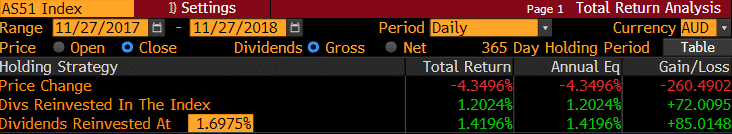
6 month return; ASX 200 with and without the inclusion of dividends – down 5.04% for the 6 months excluding dividends, down 4.37% if dividends were reinvested 1 year return; ASX 200 with and without the inclusion of dividends – down 4.34% excluding dividends, up 1.2% if dividends were reinvested
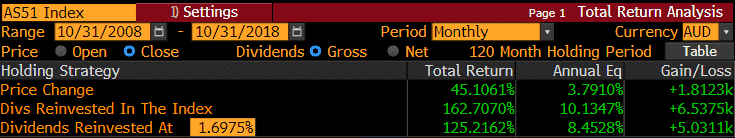
 10 year return; ASX 200 with and without the inclusion of dividends – up an annual equivalent of 3.79% excluding dividends, up 10.13% annually if dividends were reinvested.
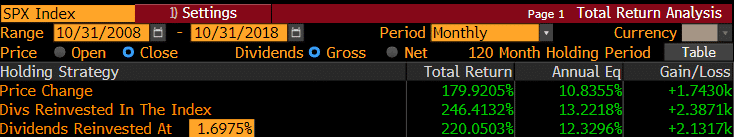
 Looking at the same stat for the US market shows an annual equivalent of 13.2% assuming dividends are reinvested in the index.
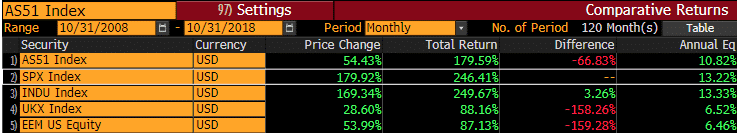
 Looking at the returns of the Australian market (excluding dividends) versus other global markets all converted back to $US shows underperformance annually of 2.4% over the past 10 years versus US stocks however outperformance versus both the UK and emerging markets (EEM). US stocks have added ~13% annually over the past 10 years while the Australian market has added nearly ~11%.
Since the inception of the Dow Jones back in 1928 the index has returned ~10% annually. Australia is similar with the All Ords returning just shy of 10% per annum since 1900, with around 8 out of every 10 years generating positive returns.
Comparable 10 year returns in $US – ASX 200 (AS51), S&P 500 (SPX), INDU (Dow Jones), UKX (FTSE 100), EEM (Emerging Markets)
Looking at the returns of the Australian market (excluding dividends) versus other global markets all converted back to $US shows underperformance annually of 2.4% over the past 10 years versus US stocks however outperformance versus both the UK and emerging markets (EEM). US stocks have added ~13% annually over the past 10 years while the Australian market has added nearly ~11%.
Since the inception of the Dow Jones back in 1928 the index has returned ~10% annually. Australia is similar with the All Ords returning just shy of 10% per annum since 1900, with around 8 out of every 10 years generating positive returns.
Comparable 10 year returns in $US – ASX 200 (AS51), S&P 500 (SPX), INDU (Dow Jones), UKX (FTSE 100), EEM (Emerging Markets)