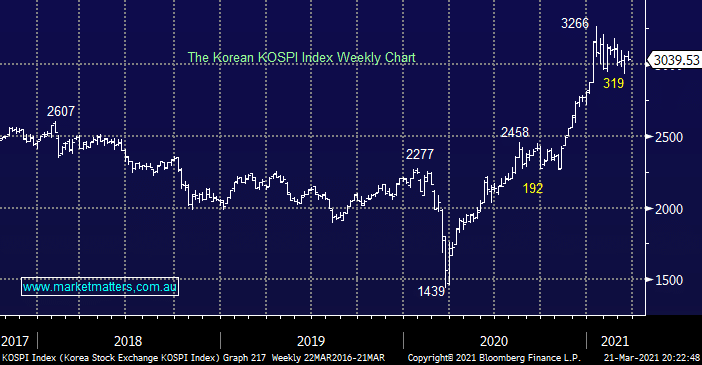
Global stocks ended mixed last week but most definitely not negative with the MSCI World Index closing less than 1.5% below its all-time high. At times like this when market indices are trading in a choppy manner we often look at a number of different major markets which in our opinion offer the greatest clarity from a technical perspective. My favourite after scanning the boards last night was Korea’s KOSPI which remains bullish initially targeting a further 10-15% upside which by definition provides us with a comforting read through for equities in general.

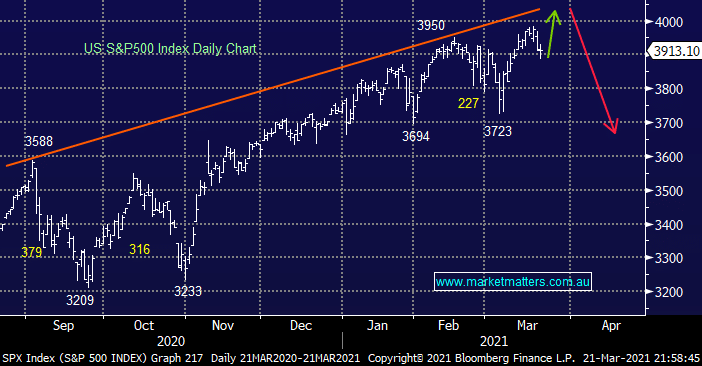
A number of the major US indices have been skewed by the significant underperformance of the tech sector as longer dated bond yields have climbed on fears of rising inflation. However we feel the S&P500 has performed extremely well considering its ~25% exposure to tech illustrating the broad market remains healthy, after all it is less than 2% below its all-time high.
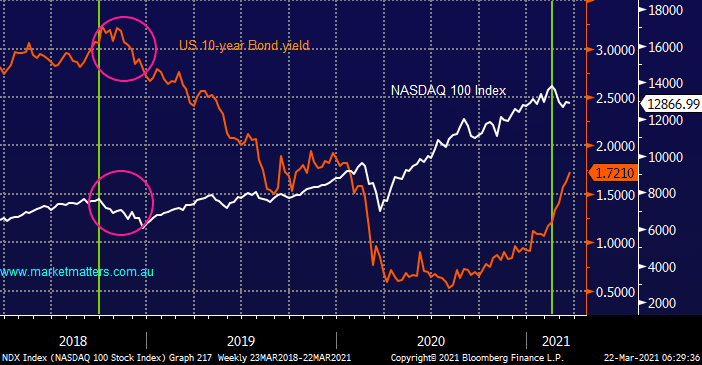
The chart below shows that back in Q4 of 2018 the tech based NASDAQ wobbled badly when bond yields rallied, a fall that makes the recent pullback appear insignificant in comparison, especially when we consider the massive rally by yields in 2021. The difference this time being investors anticipated yields were set to rise, it’s just been the speed of the ascent which has caught some people complacently long bonds (effectively bearish on yields).
Hence a period of consolidation by yields could see a snap reversion back towards the growth sector, at least temporarily. Note in the chart below the clear time lag between rising bond yields and the NASDAQ turning lower, we feel this will play out in reverse with stocks recovering before bond yields pull back.