Subscribers questions (PPE, BKL, EVN, CDE US,RIO, AMP)
As we said last week the current market rhythm is being dictated by the escalating news flow around the spread of coronavirus, this morning the death toll has hit 304 and over 14,500 people are infected worldwide. Unfortunately, things still appear likely to get worse before they improve but from a market perspective we must always remember that equities don’t trade in the now, they look at least 6-months in advance.
The extrapolations I quoted last week of an estimated 60,000 infections and 1,500 deaths is appearing more realistic by the day making the outbreak significantly worse than SARS on both levels. However, China is clearly combatting this outbreak far better than in 2003 so let’s all hope and pray that the doomsday merchants get this one well and truly wrong. Science has progressed enormously in 16-years hence a concerted global effort will hopefully deliver the much-needed vaccine sooner rather than later.
Once things are under control investors should not underestimate how aggressively China are likely to kick start their economy. Wuhan at the epicentre of the virus has just opened a 1000 bed emergency hospital in an amazing 10-days, no delays with the Peoples Republic of China. Over the weekend the PBOC announced an almost $US22bn package of market support for today i.e. they aren’t going down without a fight. Remember in 1998 George Soros got hammered trying to break the Hong Kong Dollar, when the PBOC acts don’t stand in their way, similar to that post GFC adage “don’t fight the Fed”.
MM believes the coronavirus inspired sell-off in equities is a buying opportunity.
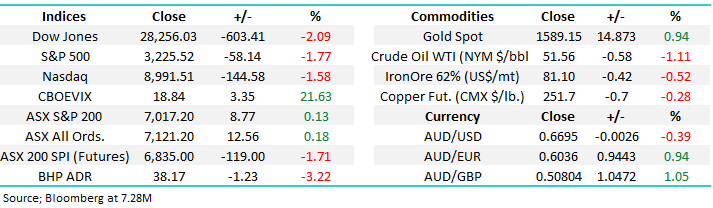
On Friday night US stocks were smacked with the Dow falling over 600-points and the SPI Futures implying the ASX200 will open down almost 120-points, we feel this will be a buying opportunity especially with the PBOC flexing their muscles.
Thanks again for the questions today, a few less than recently probably due to investors’ fixation with the coronavirus but we enjoyed a record number of compliments, thanks I’ll take that all day!
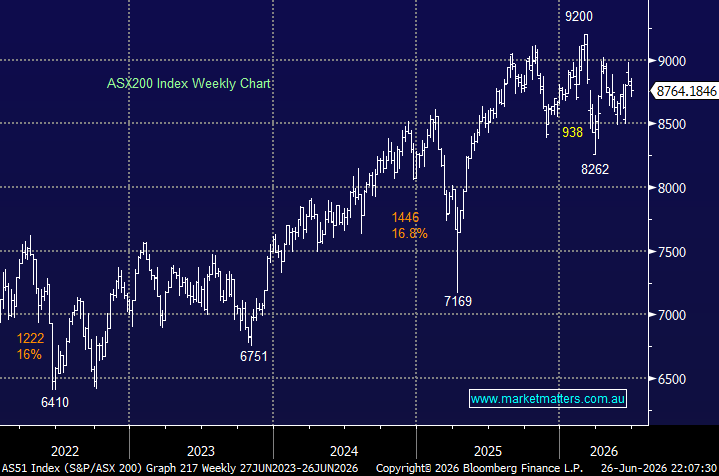
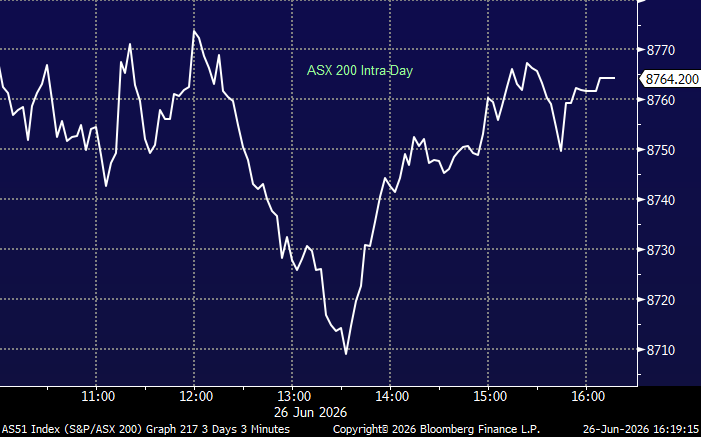
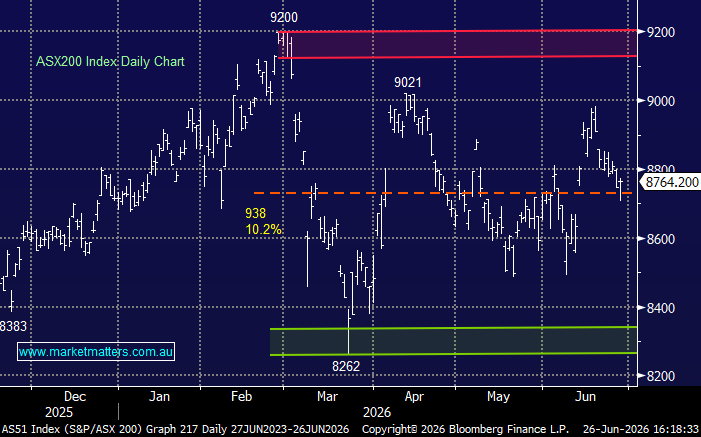
ASX200 Index Chart
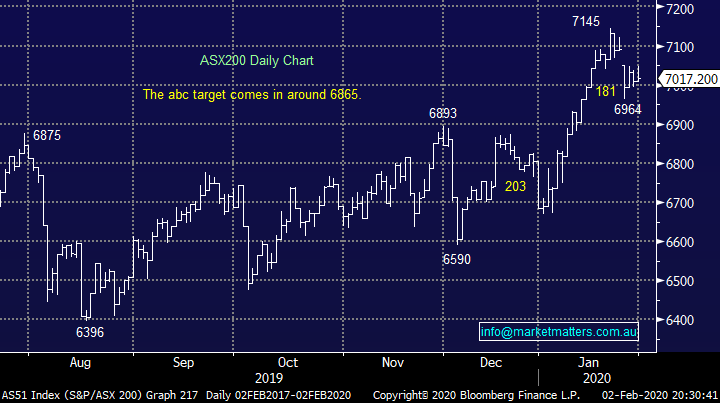
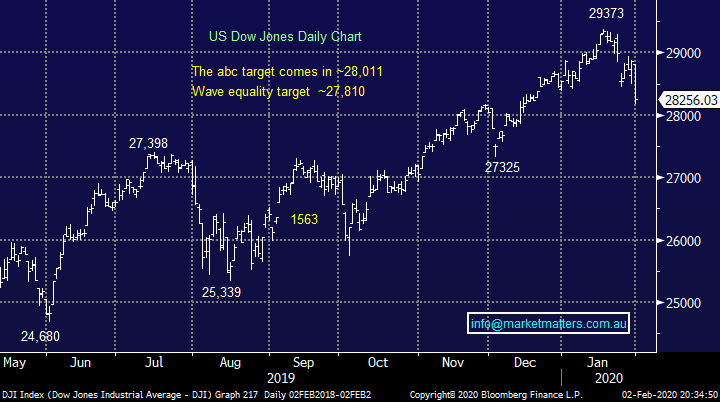
US indices closed down for the year on Friday but remember our preferred scenario: for the last few weeks we have been targeting a pullback to a touch below Fridays close - hence don’t panic, things are unfolding according to plan, so far at least:
MM is looking to start buying / accumulating stocks, tweaking our portfolios, into this current weakness.
US Dow Jones Index Chart
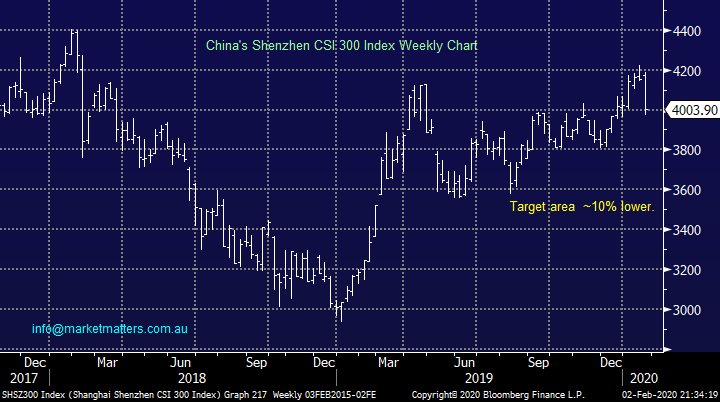
We anticipate Chinese stocks to dictate the markets sentiment today after being closed through most of the coronavirus outbreak, forecasting how things will unfold today is similar to roulette but we do know ~10% lower we feel the risk / reward will become attractive for Chinese stocks however the announced intervention by the PBOC might limit losses to only half of this, at least for now.
MM likes Chinese stocks ~10% below their last close.
China’s Shenzhen CSI 300 Index Chart
Question 1
“Hi guys, thanks for the service I’m very happy I joined the service last October and I look forward to the daily notes and alerts. It has helped me greatly in how I manage my SMSF portfolio great work. I’m looking at ways to play the disaster infrastructure rebuild that is going to have to be implemented across the country , apart from Boral and building materials companies any thoughts on a company called People infrastructure ASX code PPE or any other areas that may grow due to this rebuild phase.” - Thanks, and Regards Rob V.
Hi Rob,
Thanks for the positive feedback, it’s always much appreciated.
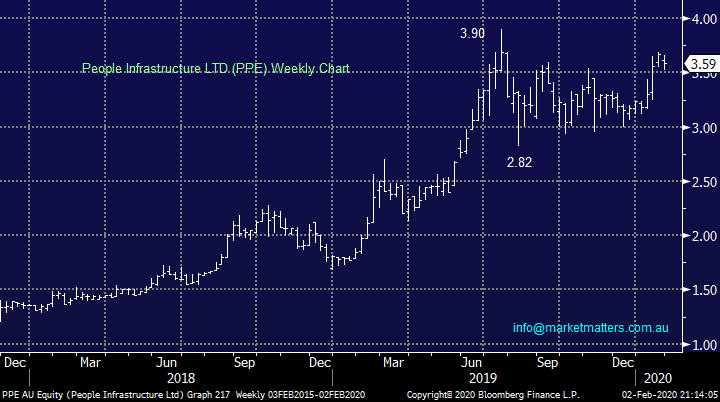
In general terms, PPE is a relatively small $263m business that provides workforce management systems to contractors in Australia and NZ servicing sectors like infrastructure, mining and hospitality. Revenue increased almost 27% in 2019 to $278m illustrating the companies potential especially as profits also increased on expanding margins, a wonderful combination. We haven’t invested in PPE previously but it’s a business we like and technically a rally towards $4 looks likely.
MM is bullish PPE targeting $4.
Overall MM like yourself is keen on the building / infrastructure space anticipating some much-needed stimulus in the years ahead hence a few stocks like PPE and BLD makes sense to similar thinking investors.
People Infrastructure Ltd (PPE) Chart
Question 2
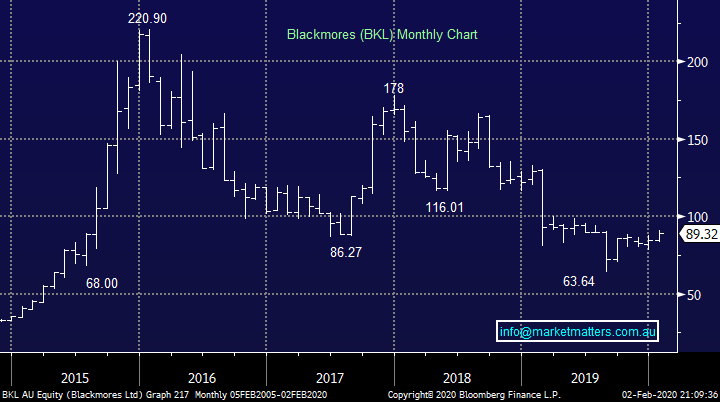
“Hello, I signed up recently, am enjoying your regular and useful updates. I have a question about Blackmores. I have purchased Blackmores shares at $68. It is currently trading at $87-$88 mark and looks going good. Do you see an upside in holding this for long term, or would you recommend taking profits and entering into some other position/company?” - Thanks, Vibs W.
Hi Vibs,
Welcome onboard and thanks for the early thumbs up!
Blackmores (BKL) is a stock we haven’t been keen on at MM and its obviously had a torrid 3-years more than halving in price, yet the stock still trades on a fairly rich estimated P/E of 31.5x for 2020. Earnings in 2019 were disappointing as the companies been struggling to execute its plans within China where there’s always the risk of legislation hindering their plans for expansion, there’s too many unknowns at present for MM although technically its look ok with stops only 2% lower.
MM has no plans to invest in BKL.
Blackmores (BKL) Chart
Question 3
“Hi Team, Thanks for a great and profitable service over the last year or so—don’t ever stop!!! Happy Belated New year to all. I have been running my own SMSF portfolio for many years, but became disillusioned with the “advice”/newsletter/broker industry in general and sold the lot and replaced everything with my own system picks just after Trump was ushered in. Since then I’m happy to say I’m 45% up (excluding all the nice dividends) with low risk stocks , and my “old experts” portfolio would have shown maybe 10% growth for the period...I have you MM guys to thank for quite some of that—so thanks. I have a few questions that I hope you can help with.
- EVN/DCN—I bought these mid last year I think after avoiding the gold sector successfully for about 20 years! Since then, I continue to see DCN running at around 195% profit and EVN a steady 20 odd % loss, despite EVN having, according to brokers a “pristine “balance sheet, good management, reserves and prospects. DCN not quite so glowing, but far more profitable (so far) Given that gold stocks are a capital growth play (negligible dividends), I wonder what your opinion is of EVN growth possibilities for remainder of this FY? (I’m tempted to sell both to be honest…. certainly, watching the stubborn red colour attached to EVN gets a bit old.)
- WHC/CRN ….
Can you comment on your feelings about the coal sector going forward? Again a sector I have had little experience with., I have been watching these two for a long time now and note they have had a long running and substantial fall from their highs, but they both seem to be solid companies with very manageable debt levels, good management and leases/product, and seem well able to continue to pay a healthy dividend.
Given my MO is to look for sound companies that pay 4% or more and have a good chance of appreciating 10% p.a. or better, my inexpert feeling is they are at a low risk price right now?? Summarising I’m looking at buying CRN/WHC/MTS/WBC with the above strategy in mind—your thoughts appreciated--any other suggestions most welcome.” – Cheers Paul A.
Morning Paul,
Thanks Paul, your email question put a huge smile on my face, it basically sums up why MM exists. I have provided a quick thought on the 6 stocks you’ve mentioned which hopefully adds some value:
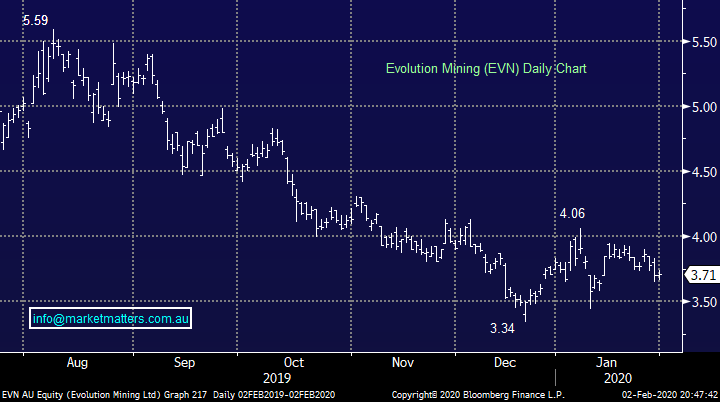
1 – Evolution (EVN) has been a thorn in our side recently and we are monitoring it carefully for optimum exit opportunities however the stocks not expensive trading on an Est 2020 P/E of 17.9x plus it yields 3.7% fully franked. At this stage the next 10-15% looks to be up but as I said on the weekend, I’m wary of stocks that don’t react to positive news flow.
2 – Dacian Gold (DCN) has recovered strongly from its lows mid-last year but the current $1.50 appears to be a brick wall at present. We’re neutral here but a quick 25% pullback would not surprise after its more than tripled from its recent 37.5c low.
3 – We have discussed WHC a few times of late and although we can see definite value in the stock below $2.50 the weight of sellers / lack of buyers as fossil fuel stocks have become un-investable for many funds. Value is emerging below $2.50 but it’s not for us.
4 – Metcash (MTS) is looking interesting around $2.50 and its compelling enough for us to have added the company to our Income Portfolio last week with one clear eye on its estimated 5.2% fully franked yield - https://www.marketmatters.com.au/new-income-portfolio-csv/
5 – We continue to like the Australian big 4 banks including Westpac which is illustrated by the fact were long. In two of our portfolios - https://www.marketmatters.com.au/new-portfolio-csv/
6 – Coronado (CRN) is another coal company that’s been sold off to extremely cheap levels although we believe these valuations are likely to persist, we see value in CRN around $2 but like WHC it’s not for us.
Evolution Mining (EVN) Chart
Question 4
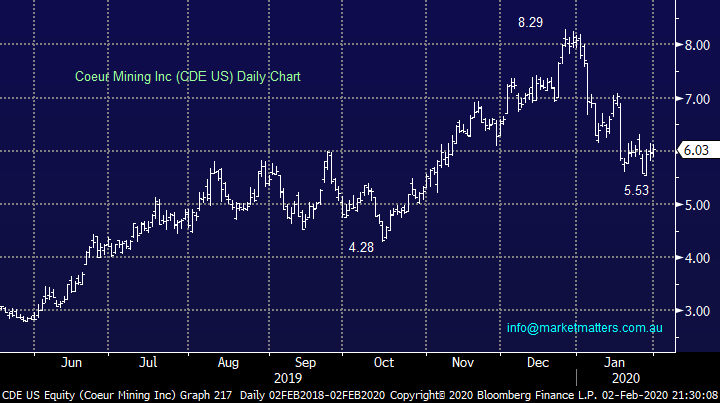
“If you are increasing the gold stock holdings, would you consider CoeurD'alene Mines-US (CXC)? I noticed that the stock came down from $7.28 on 18/12 to $5.60 yesterday. It could be good risk / reward unless the company has announced some bad news that I am not aware of.” – Thanks Greg C.
Hi Greg,
I assume you meant Chicago based mining company CDE as opposed to CXC. We aren’t particularly familiar with this business but its corrected in a very similar manner to the likes of Newcrest (NCM) and Evolution (EVN) hence we see no reason to venture so far afield for gold exposure plus as we’ve said over the last week the sectors concerning us by its lack of ability to rally on “good news”.
MM is neutral CDE.
Coeur Mining Inc (CDE US) Chart
Question 5
“HI James, I am fairly new to your service and very glad of the decision I made to be a subscriber. Thanks for the great service.
1 – Could you recommend a charting program for US stocks? Or is there an interactive charting program on the Web?
2 – Could you redefine “fading” again, any chance of your using a more friendly word instead?
Much gracias” - Indran.
Hi Indran,
Welcome on board! Hopefully my answers aren’t too disappointing
1 – We don’t believe in “Charting Packages” you can buy off the shelf, this is something investors need to evolve themselves, it’s a subjective science that simply needs the hard yards to be put in. We use Bloomberg however a simple charting package that allows you to get the rhythm of the market would do.
2 – Fading is simply buying a falling market on the backfoot or vice versa with a rising market. We use the term fading because if a stock falling, we might buy it in 2-3 tranches as opposed to going all in on day 1, although we have also been known to do this!
Question 6
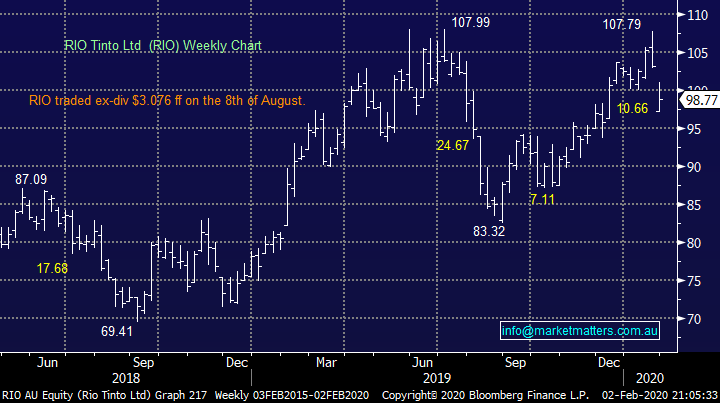
“Hi Team, I have been noticing for quite some time that on some stocks on both the buy and sell listings for the same stock on the market there is the same number every two cents for a buy and a different (but similar) number applying for a sell. These buys and sells can account for a high percentage of the total number of a particular stock for a buy or sell. An example in recent times almost daily is for MQG and RIO. What is going on and why is this permitted by the Stock Exchange?” - Regards Peter B.
Morning Peter,
It’s generally computers trading small orders for a number of reasons. The ASX likes it as it increases volume which is ultimately a good thing. As far as MM is concerned the more volume in the screen the better, we want deep liquidity when we’re buying, or selling.
RIO Tinto (RIO) Chart
Question 7
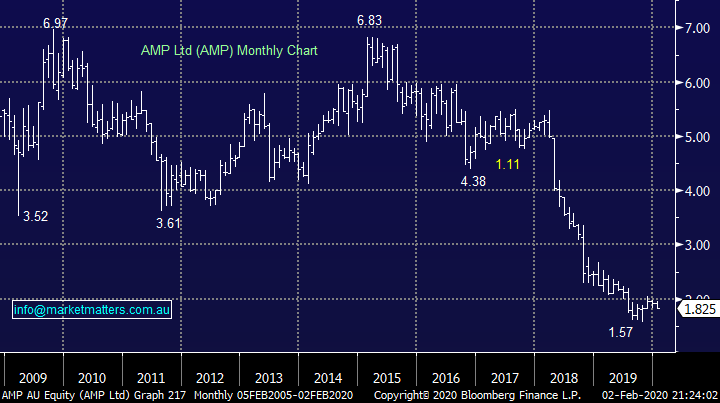
“Hey James, any thoughts on AMP and Metrics Credit Master Income Trust. Returned about 5% in the last 12-months and looks relatively safe??” - Cheers Tim N.
Morning Tim,
AMP is in the too hard basket, it will probably bounce over 25% at some stage in 2020 but a heap of money has been lost by investors trying to pick a bottom in this market underperformer.
We own MCP Metrics Master Income Trust (MXT) in our Income Portfolio and wrote the following on it a while back – still remains true.
MCP Income Opportunities Trust (MOT) $2.06: After the success of MXT, Metrics came back to market with another offering in May of this year which we described at the time as being MXT’s riskier cousin. The fund invests in a number of different sub trusts with the underlying investments being higher risk credit described as sub investment grade. They pay higher yield but come with a higher level of risk. The manager has more discretion in MOT than they do in MXT to take advantage of opportunities as they arise, however less structure means returns rely more heavily on the Portfolio Manager getting it right. There is a bunch of risk management limitations in MXT that are not in MOT and as a consequence the risk is higher and so to the targeted returns, 7% p.a. income (plus a few % capital growth to get the 8-10% total return target).
What we like: A higher risk, higher return offering from a quality manager with a good track record, distributions will not be topped up by capital if there is a shortfall in income from loans.
What we don’t: High fees with annual management fee of 1.45% and a pretty aggressive +15.38% performance fee over RBA + 6% benchmark. Worth noting that with the RBA rates below 1%, the performance fee will be paid before the income target of 7% is hit and distributed. On the flipside, if the RBA raise rates this becomes a more challenging task and given the broad structure of the trust and discretion of the Manager it could push them to take more risk to achieve performance targets.
AMP Ltd (AMP) Chart
Question 8
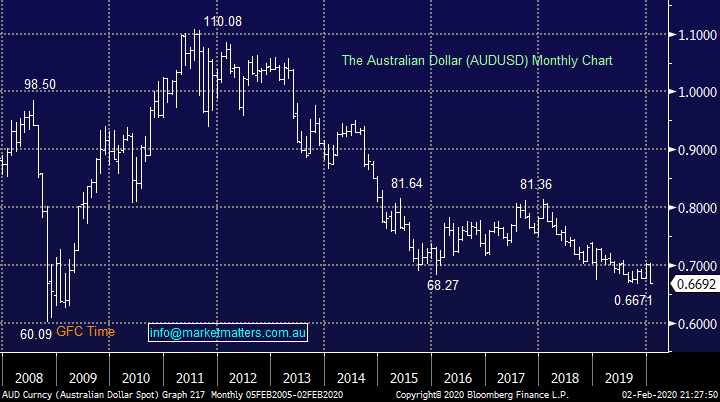
“Hi again Sorry to post another question. Can you please give a more in-depth analysis on why you think the AUD is headed to 80. If you have already done that in previous posts can you provide the link. I always love a contrarian view and as an importer this type of reading is pure business porn.” - Cheers Tim N.
Hi Tim,
The Aussie certainly feels heavy at present which makes sense because our largest trading partner China is in the middle of the worrying coronavirus outbreak. However our view at MM is we are close to seeing a commodity led global pick-up in inflation which historically is bullish the $A, this is before we even consider the huge negative opinion / positioning towards our little Aussie battler – things always look and feel the worse at the bottom.
MM remains bullish the $A targeting the 80c area.
Australian Dollar ($A) Chart
Overnight Market Matters Wrap
- Risk off continued across the globe as investors fear the pace of the coronavirus contagion growth rate magnifies. This led to the key major US indices to lose all its gain for January and end in the red sea.
- The volatility index climbed, yet it remains below the BREXIT peak and recent recession fears level.
- We are expecting a volatile session today, domestically as China markets reconvene today after a week’s break in celebration of the Lunar New Year with the emerging markets to underperform. BHP is expected to plumb further after ending its US session off an equivalent of 3.22% from Australia’s previous close.
- The March SPI Futures is indicating the ASX 200 to start the first day of February on a low and open 110 points lower, towards the 6905 level this morning.
Have a great day!
James & the Market Matters Team
Disclosure
Market Matters may hold stocks mentioned in this report. Subscribers can view a full list of holdings on the website by clicking here. Positions are updated each Friday, or after the session when positions are traded.
Disclaimer
All figures contained from sources believed to be accurate. All prices stated are based on the last close price at the time of writing unless otherwise noted. Market Matters does not make any representation of warranty as to the accuracy of the figures or prices and disclaims any liability resulting from any inaccuracy.
Reports and other documents published on this website and email (‘Reports’) are authored by Market Matters and the reports represent the views of Market Matters. The Market Matters Report is based on technical analysis of companies, commodities and the market in general. Technical analysis focuses on interpreting charts and other data to determine what the market sentiment about a particular financial product is, or will be. Unlike fundamental analysis, it does not involve a detailed review of the company’s financial position.
The Reports contain general, as opposed to personal, advice. That means they are prepared for multiple distributions without consideration of your investment objectives, financial situation and needs (‘Personal Circumstances’). Accordingly, any advice given is not a recommendation that a particular course of action is suitable for you and the advice is therefore not to be acted on as investment advice. You must assess whether or not any advice is appropriate for your Personal Circumstances before making any investment decisions. You can either make this assessment yourself, or if you require a personal recommendation, you can seek the assistance of a financial advisor. Market Matters or its author(s) accepts no responsibility for any losses or damages resulting from decisions made from or because of information within this publication. Investing and trading in financial products are always risky, so you should do your own research before buying or selling a financial product.
The Reports are published by Market Matters in good faith based on the facts known to it at the time of their preparation and do not purport to contain all relevant information with respect to the financial products to which they relate. Although the Reports are based on information obtained from sources believed to be reliable, Market Matters does not make any representation or warranty that they are accurate, complete or up to date and Market Matters accepts no obligation to correct or update the information or opinions in the Reports. Market Matters may publish content sourced from external content providers.
If you rely on a Report, you do so at your own risk. Past performance is not an indication of future performance. Any projections are estimates only and may not be realised in the future. Except to the extent that liability under any law cannot be excluded, Market Matters disclaims liability for all loss or damage arising as a result of any opinion, advice, recommendation, representation or information expressly or impliedly published in or in relation to this report notwithstanding any error or omission including negligence.