Is it time to buy the FAANG stocks?
With regards to the ASX200 we often say ”the market cannot go up without the banks” well in the US the same is probably true for the FANG stocks, at MM we add influential Apple (AAPL) to the normal 4 stock group to become Facebook (FB), Apple (AAPL) / Amazon (AMZN), Netflix (NFLX) and Google (GOOGL).
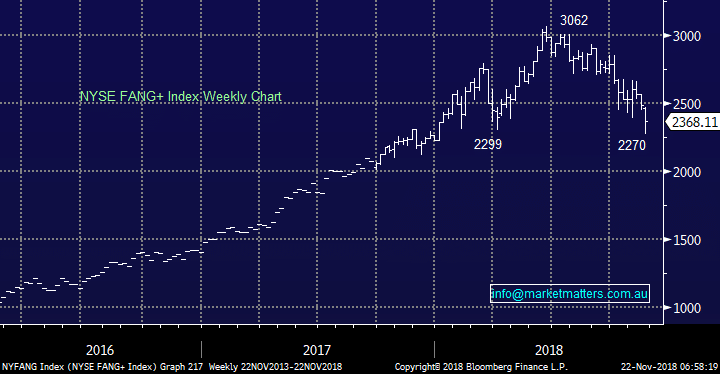
The Fang+ Index shown below has corrected just under 26% since its June high – this index actually contains other highly traded growth stocks like Alibaba (BABA), Twitter (TWTR) and Tesla (TSLA) but it’s a fair reflection of the classic group of US Growth stocks.
The trend following / momentum players (we often refer to as lemmings) chased this growth group of tech names up ~200% over 2-years making the current correction of this advance very normal in usual market dynamics but it just doesn’t feel normal when you watch say Apple (AAPL) plunge 25% in just 2-months.
NYSE FANG Index Chart
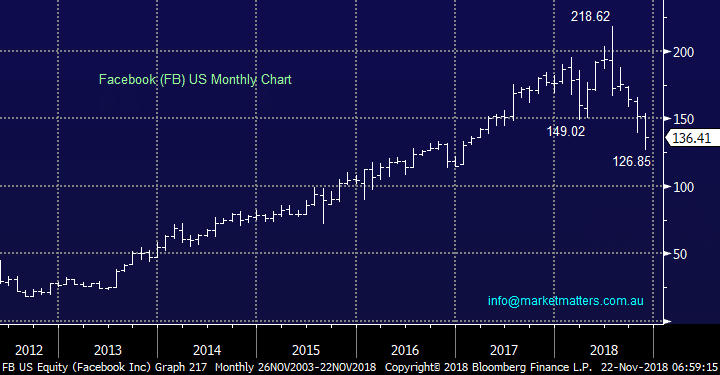
 1 Facebook (FB) $US136.17
Facebook (FB) has corrected 42% from its July high on a tide of risk aversion and its own internal issues around privacy and corporate structures.
A huge amount of optimism has been removed from the social networks share price and an Est P/E for 2018 of 18.4x is now not too scary on a valuation perspective.
Facebook (FB) Chart
1 Facebook (FB) $US136.17
Facebook (FB) has corrected 42% from its July high on a tide of risk aversion and its own internal issues around privacy and corporate structures.
A huge amount of optimism has been removed from the social networks share price and an Est P/E for 2018 of 18.4x is now not too scary on a valuation perspective.
Facebook (FB) Chart
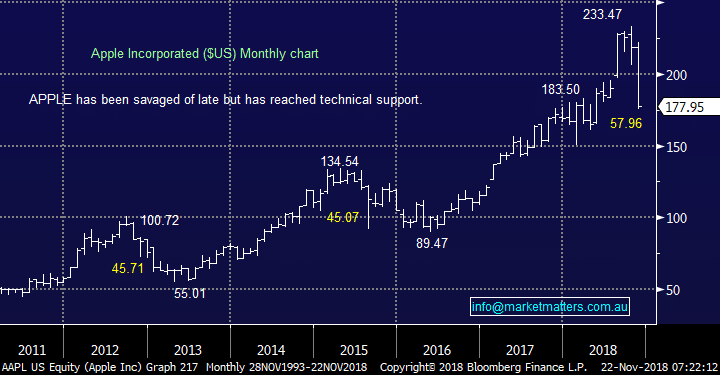
 2 Apple (AAPL) $177.98.
Apple (AAPL) has now corrected 24.8% since its October all-time high with the vast amount of this damage unfolding over the last few weeks following escalating concerns around demand for new iPhones moving forward.
Apple is now trading on 13x forward earnings while delivering growth of 14%, clearly attractive numbers but the stock’s very out of favour at present – remember elastic bands usually stretch too far.
Apple (AAPL) Chart
2 Apple (AAPL) $177.98.
Apple (AAPL) has now corrected 24.8% since its October all-time high with the vast amount of this damage unfolding over the last few weeks following escalating concerns around demand for new iPhones moving forward.
Apple is now trading on 13x forward earnings while delivering growth of 14%, clearly attractive numbers but the stock’s very out of favour at present – remember elastic bands usually stretch too far.
Apple (AAPL) Chart
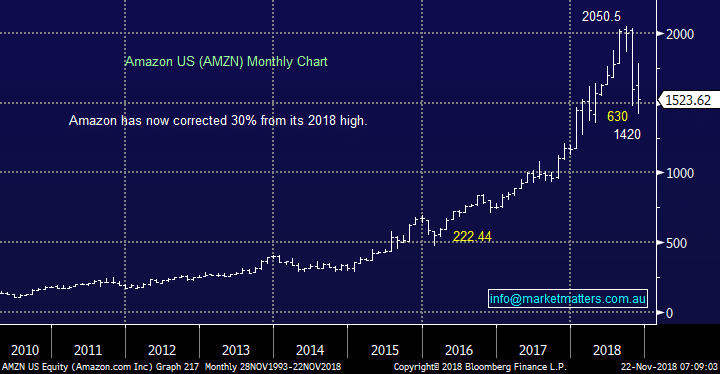
 3 Amazon (AMZN) $1524.80.
Amazon (AMZN) has now corrected 30% from its September high and has reached its $US1400 major support area.
Similar to our long-term view on the NASDAQ we can see Amazon trading between 1250 and 1750 for the next few years as it simply takes a rest after its dramatic rally since the GFC.
Amazon (AMZN) Chart
3 Amazon (AMZN) $1524.80.
Amazon (AMZN) has now corrected 30% from its September high and has reached its $US1400 major support area.
Similar to our long-term view on the NASDAQ we can see Amazon trading between 1250 and 1750 for the next few years as it simply takes a rest after its dramatic rally since the GFC.
Amazon (AMZN) Chart
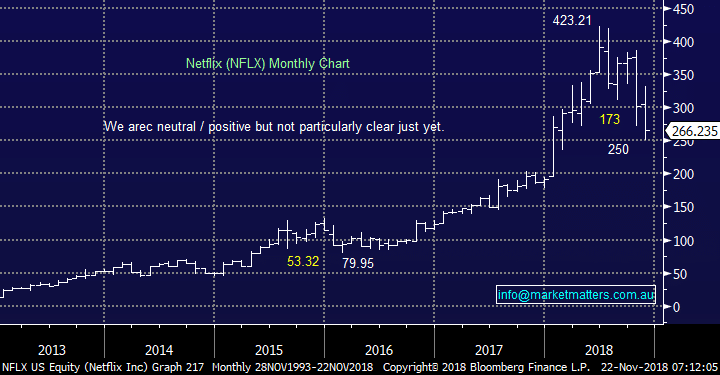
 4 Netflix (NFLX) $266.23.
Netflix (NFLX) has now corrected 41% from its June high with the last 2-months more than doubling the losses.
The internet TV business has grown extremely well over the last 3-years but its very elevated valuation continues to concern us moving forward.
Netflix (NFLX) Chart
4 Netflix (NFLX) $266.23.
Netflix (NFLX) has now corrected 41% from its June high with the last 2-months more than doubling the losses.
The internet TV business has grown extremely well over the last 3-years but its very elevated valuation continues to concern us moving forward.
Netflix (NFLX) Chart
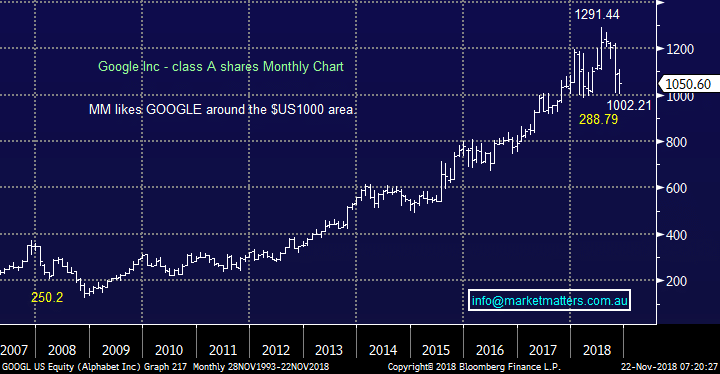
 5 Google Alphabet (GOOGL) $1049.35.
Google (GOOGL) has now corrected 22% from its July high making it clearly the most stable / orderly within the group.
Google Alphabet (GOOGL) Chart
5 Google Alphabet (GOOGL) $1049.35.
Google (GOOGL) has now corrected 22% from its July high making it clearly the most stable / orderly within the group.
Google Alphabet (GOOGL) Chart