Market Matters Afternoon Report Wednesday 17th August 2016
Good Afternoon everyone
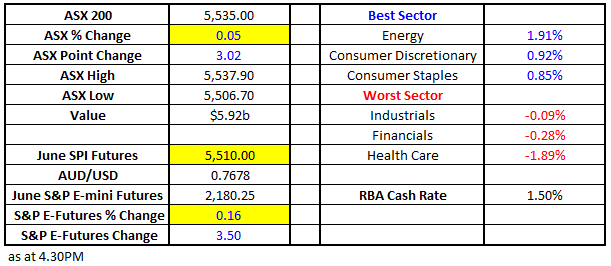
Market Data
What Mattered Today
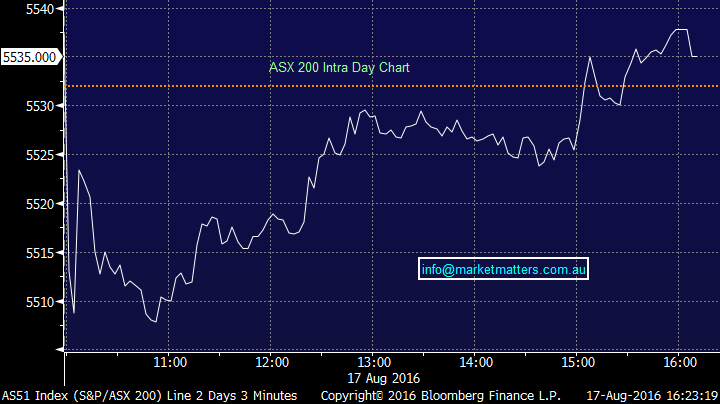
A pretty good session really with CBA going ex-dividend $2.22 (and dropped just $1.96) taking 11 points off the index while the other banks were well bid – as were the resource stocks led by BHP which put on +3.26% to close at $20.91. The index traded up strongly after a weak open…
We had a range of +/- 31 points, a high of 5537, a low of 5506 and a close of 5535, up +3 points or +0.05%
ASX 200 Intra-Day Chart
Reporting continues to dominate trade and as per the recent trends, some big moves following results played out.
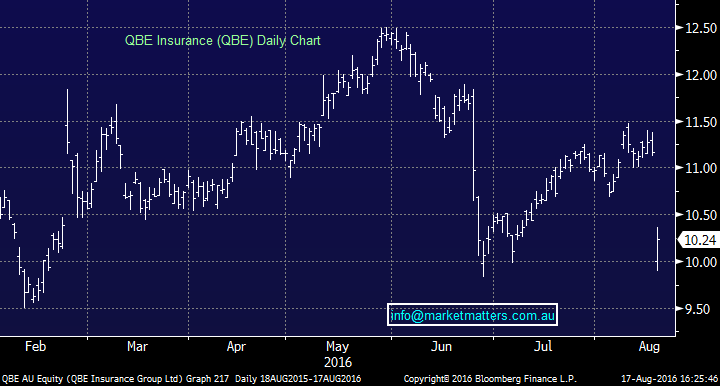
QBE Insurance (QBE) was weak as it should have been – dropping -8.33% to close at $10.24 after releasing 1st half results that were around 10% below expectations. – cash profit $287m, EPS 19.2cps and an interim dividend of 21cps.
QBE has been long touted as a macro story benefiting from a higher $US and higher US interest rates (whenever that happens) however; global commercial premium rates have continued to slide putting massive pressure on margins. A stock with a history of disappointment that certainly lived up to its reputation today.
We have no interest in QBE until it trades well under $10
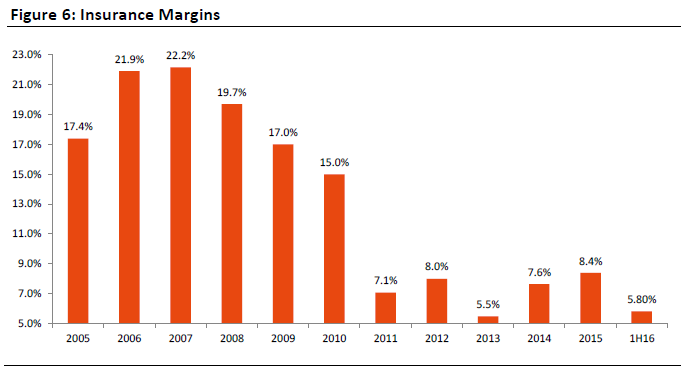
Source; Shaw and Partners Research
QBE Insurance Daily Chart
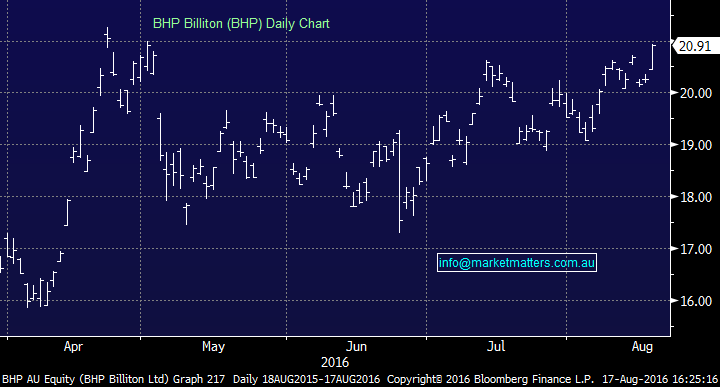
BHP was back on the board's post results yesterday, and the stock rallied well – up by +3.26%. We wrote in the morning report today the following….
BHP Billiton (BHP) announced their profit numbers after market yesterday to produce some very negative tabloid style headlines - " BHP loses $US6.38 billion!" but importantly they forecast $US7 billion free cash flow for 2017 at current consensus commodity prices.
The term ‘consensus’ is key here as that number across most of BHP’s commodity complex is substantially below current spot prices. Should commodities remain firm (or even stable) then we’ll see upgrades to consensus commodity price forecasts which will drop directly into upgrades for BHP earnings.
Simply BHP has experienced an awful year, with some big one off painful hits but the clear feeling is that FY16 was the low point for BHP earnings. The toughest of periods is now behind them, and some clear skies and outperformanceis likely.
This chart looks at BHP share price versus earnings per share. Not rocket science, however, it clearly shows that share prices will track earnings. If conditions are ripe for a period of EPS upgrades, then the share price will follow.
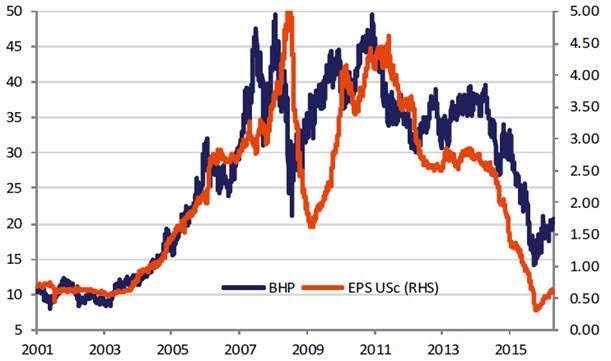
Source; Shaw and Partners Research
BHP Billiton (BHP) Daily Chart
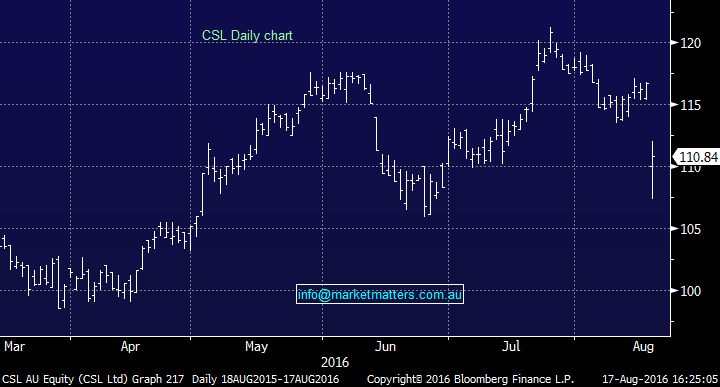
CSL Limited (CSL) reported full-year results this morning, and the stock was off sharply – by about 7% at its worst before closing down -5.06% at $110.84. The underlying earnings result was in line with expectations – the dividend was slightly higher however it was FY17 guidance that missed the market.
They guided to 11% growth in underlying net profit and 14% in operating profit for the coming 12 months which fell short of market forecasts of a rebound of about 18%. That was the main cause of the negativity, however, the drop provided an opportunity in early trade.
CSL Limited (CSL) Daily Chart
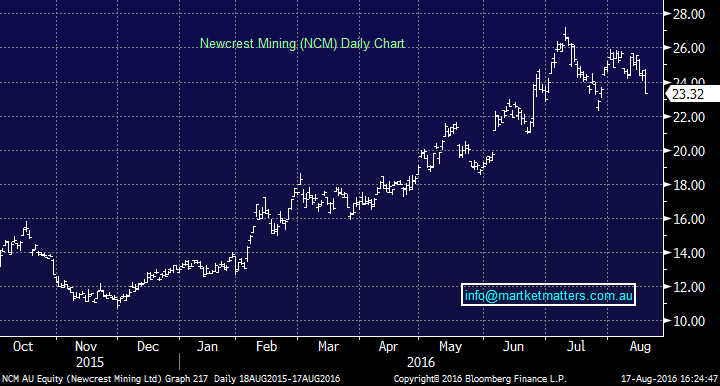
….Elsewhere, gold stocks were under pressure and continue to correct as expected with Newcrest (NCM) down another -5.47%...As written recently, we think a deeper pullback will play out before a good opportunity prevails.
Newcrest Mining (NCM) Daily Chart
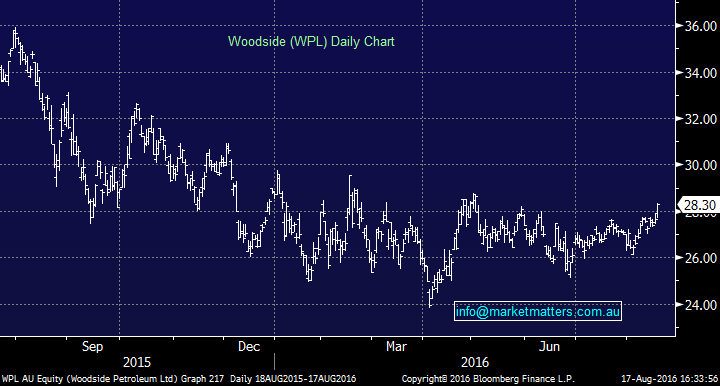
Energy stocks were firm – Origin Energy (ORG) put on +1.74% while Woodside (WPL), a recent inclusion in the MM portfolio was also strong – adding +2.35% to close at $28.30.
Woodside (WPL) Daily Chart
Sectors
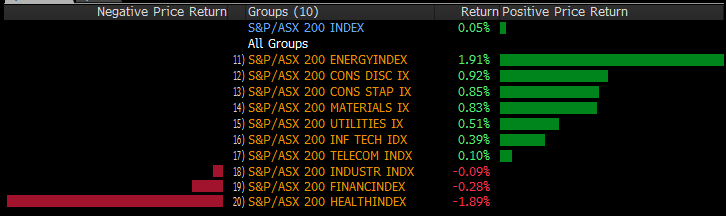
Source; Bloomberg
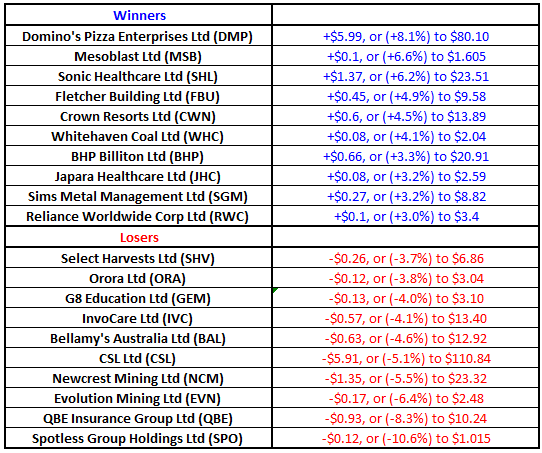
ASX 200 Movers
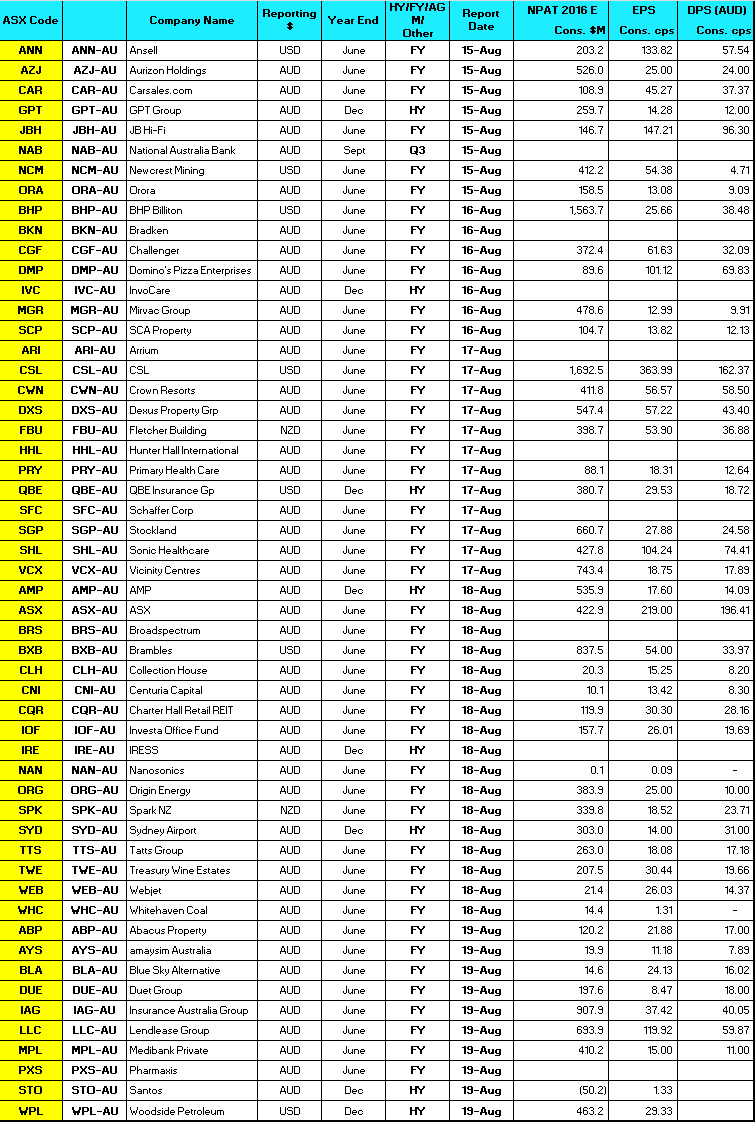
Reporting this week
NPAT = net profit after tax (consensus numbers)
EPS = earnings per share (consensus numbers)
DPS = dividend per share (consensus numbers)
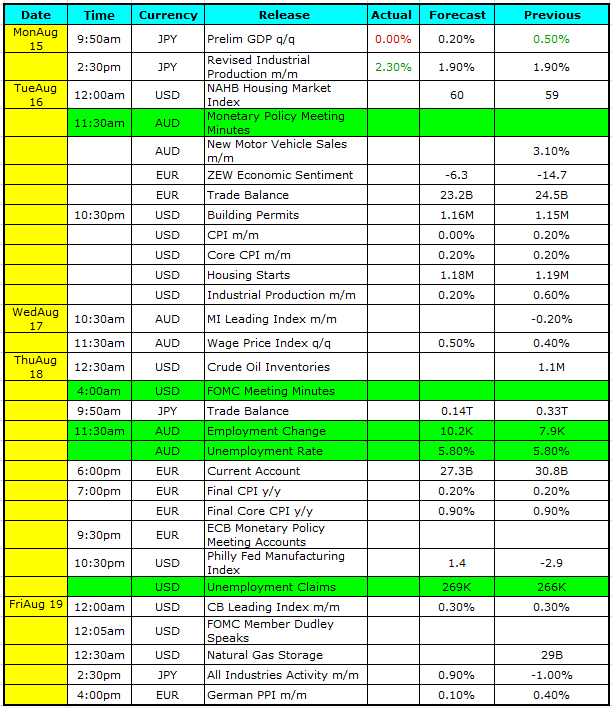
Select Economic Data – This week; Stuff that really Matters in Green
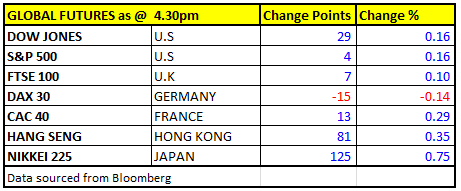
What Matters Overseas
FUTURES pointing to a reasonable start in the US…
All figures contained from sources believed to be accurate. Market Matters does not make any representation of warranty as to the accuracy of the figures and disclaims any liability resulting from any inaccuracy. Prices as at 17/08/2016. 5:00PM.
Reports and other documents published on this website and email (‘Reports’) are authored by Market Matters and the reports represent the views of Market Matters. The Market Matters Report is based on technical analysis of companies, commodities and the market in general. Technical analysis focuses on interpreting charts and other data to determine what the market sentiment about a particular financial product is, or will be. Unlike fundamental analysis, it does not involve a detailed review of the company’s financial position.
The Reports contain general, as opposed to personal, advice. That means they are prepared for multiple distributions without consideration of your investment objectives, financial situation and needs (‘Personal Circumstances’). Accordingly, any advice given is not a recommendation that a particular course of action is suitable for you and the advice is therefore not to be acted on as investment advice. You must assess whether or not any advice is appropriate for your Personal Circumstances before making any investment decisions. You can either make this assessment yourself or if you require a personal recommendation, you can seek the assistance of a financial adviser. Market Matters or its author(s) accepts no responsibility for any losses or damages resulting from decisions made from or because of information within this publication. Investing and trading in financial products are always risky, so you should do your own research before buying or selling a financial product.
The Reports are published by Market Matters in good faith based on the facts known to it at the time of their preparation and do not purport to contain all relevant information with respect to the financial products to which they relate. Although the Reports are based on information obtained from sources believed to be reliable, Market Matters does not make any representation or warranty that they are accurate, complete or up to date and Market Matters accepts no obligation to correct or update the information or opinions in the Reports.
If you rely on a Report, you do so at your own risk. Any projections are estimates only and may not be realised in the future. Except to the extent that liability under any law cannot be excluded, Market Matters disclaims liability for all loss or damage arising as a result of any opinion, advice, recommendation, representation or information expressly or impliedly published in or in relation to this report notwithstanding any error or omission including negligence.
To unsubscribe. Click Here