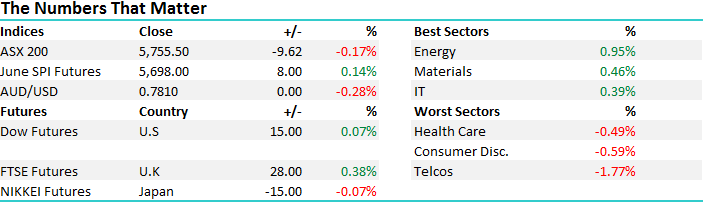
The Good, The Bad & The Ugly
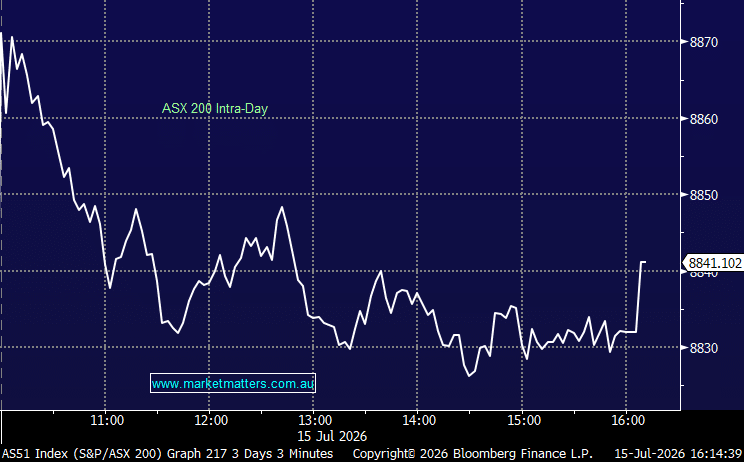
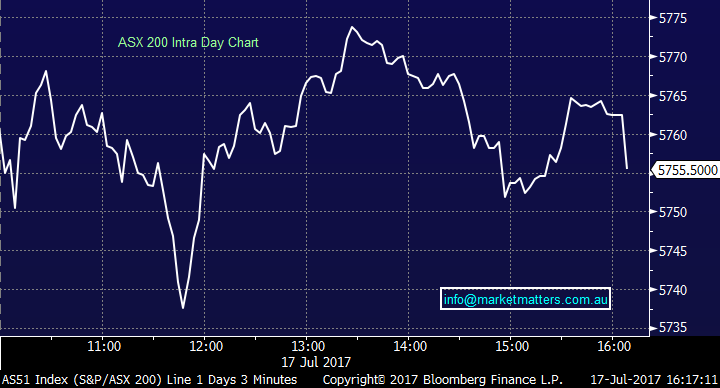
An interesting session on a few fronts today – some interesting stock moves and the index was up early, got sold between 11 & 12, rallied soon after then came under pressure again nearing the close. That’s the sort of trading that happens when someone is building a short position on an index – rallies are sold and decent volume goes through the mkt near the close – which was the case today. The last day of school holidays and we should see volume build back up in the next few days as we await news from the banking regulator over capital requirements.
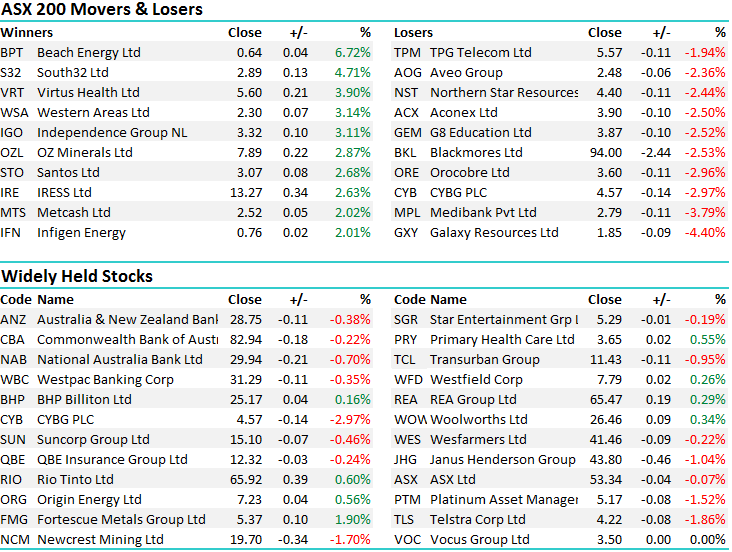
Energy and Materials stocks remained firm today while the Telco space, led by Telstra was copped most selling – down by -1.86%. An overall range of +/- 38 points, a high of 5773, a low of 5735 and a close of 5735, off -9pts or -0.17%. Banks & TLS took 8.27pts off the index!
ASX 200 Intra-Day Chart
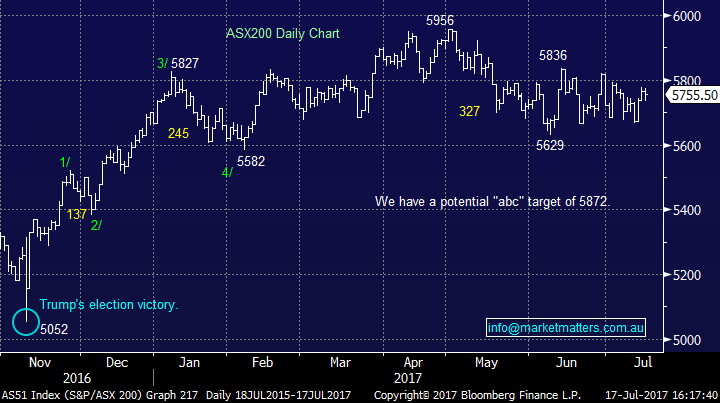
ASX 200 Daily Chart
The Good
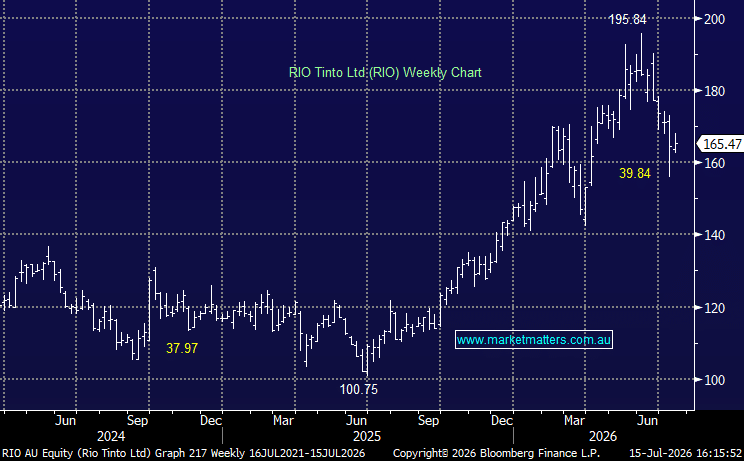
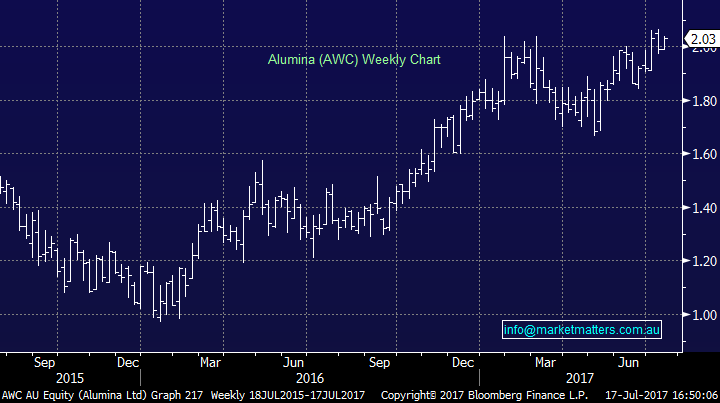
Aluminium prices have been strong in recent times and this has positive read through for some of our miners that are exposed to it. To give some context here, in 2016, the price averaged US72.8c /lb while 2017 YTD it’s averaged US85c/lb with the spot market now trading at US88.5c /lb. Consensus numbers (mkt positioning) is for US82.8c so the sector is due a 5% upgrade if spot continues to hold – which we think it will. To be clear, Aluminium and Alumina are different. Alumina is a compound, which includes aluminum element. Alumina is the common name given to aluminium oxide (Al2O3).
Anyway, without getting too bogged down, Rio and S32 have most exposure to the Aluminium price, and that’s positive for both stocks, however it won’t be the only driver of their share price given they are exposed to other commodities. Alumina (AWC) (funnily enough) is exposed to the Alumina price, and the Alumina price moves within a ~15-20% range of the Aluminium price. Aluminium prices going up is a positive for Alumina, and AWC has huge leverage to this. For instance, assume the Alumina price goes up by US$10/t, from say US$310 to US$320/t AWC’s earnings would lift by ~$210m, all things being equal. At the moment consensus is for $US290/t so we’re already likely to see upgrades come through, but if the Alumina price continues to run, then AWC could really get going.
Alcoa reports earnings on Thursday and we’ll get a better read then on this, however we like the stock at current levels and it resides in both the Platinum and Income Portfolios. The stock closed up +2.01% today at $2.03
Alumina (AWC) Weekly Chart
The Bad
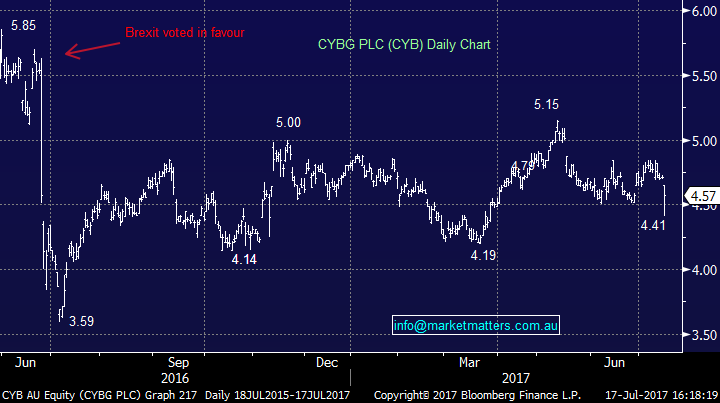
News out yesterday (late) that a class action was being launched against Clydesdale in the UK saw the stock sold heavily in early trade, only to recover some of it. No release from the company themselves however media reports saying 6,000 loans mis-sold – and could run to an aggregate value of several hundred or in the billions of pounds or substantially smaller. As shocking as this is, and banks are notorious for doing this, the actual earnings impact to CYB is likely to be small. These products (tailored business loans) have already been reviewed by the UK regulator back in 2014 and CYB has already paid out around £200m (estimation only) already. The Litigation funder is claiming CYB mishandled the actual claims process.
In terms of provisioning, CYB has access to £507m in provisions to meet any future claims before an earnings impact, they have an indemnity of £511m from NAB and has £92m in unitised provisions against non-insurance mis-selling. So, in all likelihood, there will be no earnings impact to CYB if the claims have merit, and reading the media reports, they sound like they do. On a personal level, you feel for those that have entered into products without understanding / being told the underlying metrics. All too common unfortunately.
We own CYB and the mkt overreacted this morning selling the stock off more than 5%, only to see it close down -2.97% at $4.57.
CYBG (CYB) Daily Chart
The Ugly
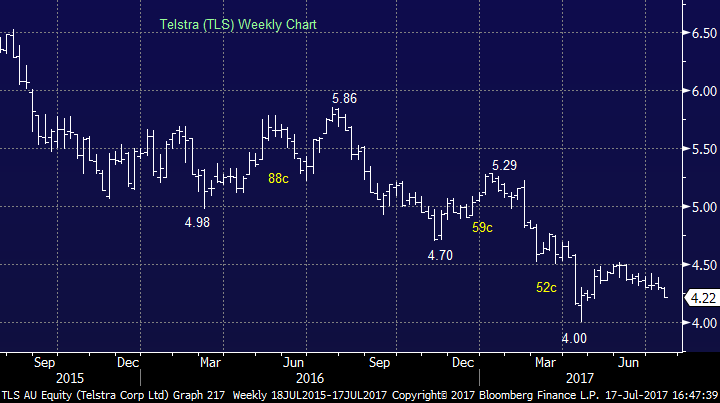
No love for Telstra today despite the media reports this am touting the ‘value’ in the Telco space following the PE interest for Vocus. We cut TLS recently for a small profit and really see no reason to be there now, other than those very conscious on yield (but that argument is starting to wear thin). Volume was big – about 50% more than usual and the stock closed on the lows. This looks very weak technically. TLS closed down -1.86% to $4.22
Telstra (TLS) Weekly Chart
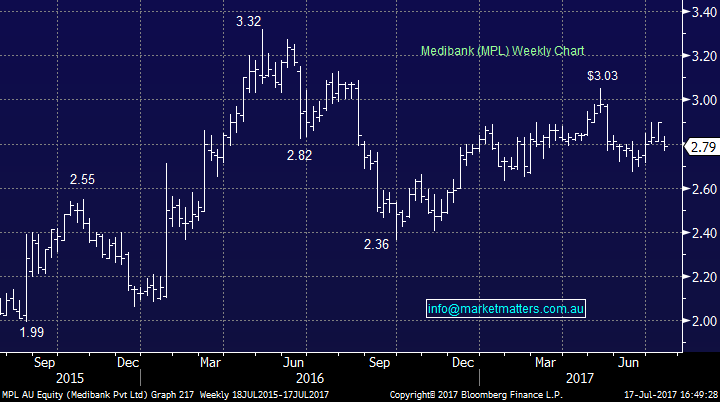
….and Medibank was also soft after Goldmans cut the stock to SELL, saying "we struggle to construct a scenario where current margins are sustainable.”
MPL closed down -3.79% to $2.79.
Medibank (MPL) Weekly Chart
Have a great night
The Market Matters Team
Disclosure
Market Matters may hold stocks mentioned in this report. Subscribers can view a full list of holdings on the website by clicking here. Positions are updated each Friday.
Disclaimer
All figures contained from sources believed to be accurate. Market Matters does not make any representation of warranty as to the accuracy of the figures and disclaims any liability resulting from any inaccuracy. Prices as at 17/07/2017. 5.00PM.
Reports and other documents published on this website and email (‘Reports’) are authored by Market Matters and the reports represent the views of Market Matters. The MarketMatters Report is based on technical analysis of companies, commodities and the market in general. Technical analysis focuses on interpreting charts and other data to determine what the market sentiment about a particular financial product is, or will be. Unlike fundamental analysis, it does not involve a detailed review of the company’s financial position.
The Reports contain general, as opposed to personal, advice. That means they are prepared for multiple distributions without consideration of your investment objectives, financial situation and needs (‘Personal Circumstances’). Accordingly, any advice given is not a recommendation that a particular course of action is suitable for you and the advice is therefore not to be acted on as investment advice. You must assess whether or not any advice is appropriate for your Personal Circumstances before making any investment decisions. You can either make this assessment yourself, or if you require a personal recommendation, you can seek the assistance of a financial advisor. Market Matters or its author(s) accepts no responsibility for any losses or damages resulting from decisions made from or because of information within this publication. Investing and trading in financial products are always risky, so you should do your own research before buying or selling a financial product.
The Reports are published by Market Matters in good faith based on the facts known to it at the time of their preparation and do not purport to contain all relevant information with respect to the financial products to which they relate. Although the Reports are based on information obtained from sources believed to be reliable, Market Matters does not make any representation or warranty that they are accurate, complete or up to date and Market Matters accepts no obligation to correct or update the information or opinions in the Reports.
If you rely on a Report, you do so at your own risk. Any projections are estimates only and may not be realised in the future. Except to the extent that liability under any law cannot be excluded, Market Matters disclaims liability for all loss or damage arising as a result of any opinion, advice, recommendation, representation or information expressly or impliedly published in or in relation to this report notwithstanding any error or omission including negligence.
To unsubscribe. Click Here