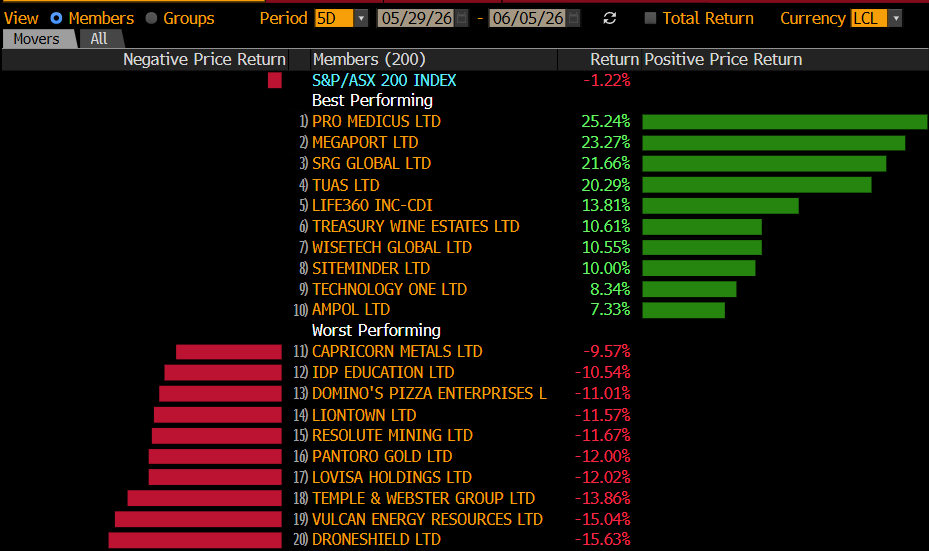
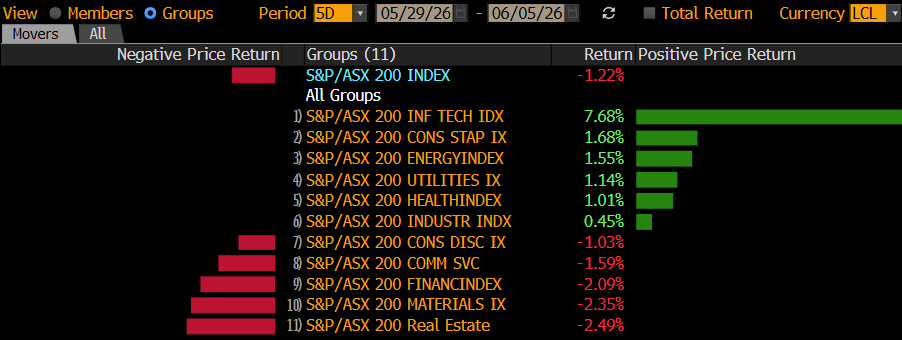
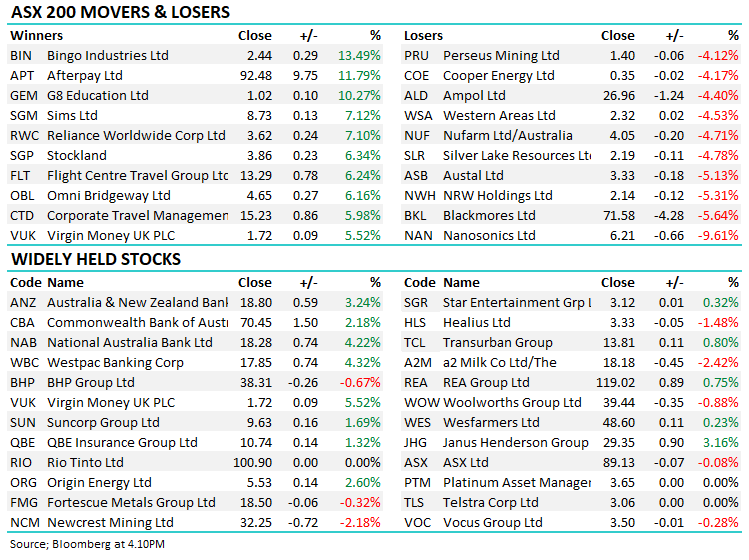
Market threatens to break out again, is it only a matter of time? (BIN, AWC, IGL, HUB, SGP)
WHAT MATTERED TODAY
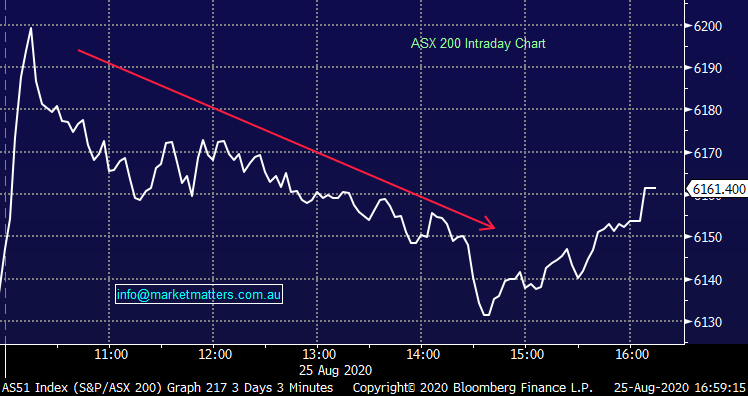
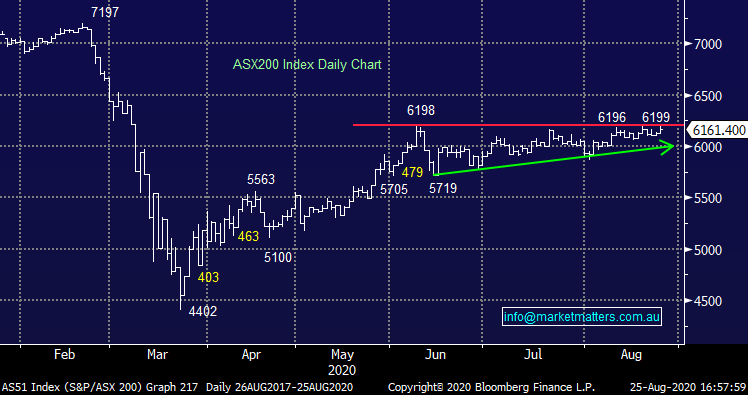
So so close again, the ASX 200 trading to a high this morning of 6199.2, but alas, the brick wall that has capped the market since the 9th June held firm. Like a caged bull (or bear), the market range is tightening and it feels a matter of time before we break with some decent momentum, MM’s view is that will be on the upside but as always, we remain open minded + will react accordingly. Again, results were mostly on the positive side today, particularly the cyclical names like Bingo (BIN) that has downbeat expectations baked into the cake which (kindly) didn’t prevail – Technology stocks were also strong.
Overseas markets were strong overnight thanks to positive developments on the virus front, the US FDA has authorized convalescent plasma treatment for COVID-19, combined with some friendly messaging from the US about its latest trade-related talks with China. That supported US stocks + Asian markets today and while the ASX was strong on open, we tailed off throughout the session, even as US Futures remained resilient.
Healthcare the major drag today, CSL again weak and while this is / remains the pin-up for local healthcare names, it still feels susceptible to further weakness in MM’s view. On the flipside, Afterpay (APT) took our morning comments on board (click here)and rallied 11.79% with BIN’s +13.49% gain the only stock to top its performance. APT closed $92.48 while Xero (XRO) topped the $100 mark early on during the session after announcing they’ve acquired cloud-based small business lending platform Waddle for $31m upfront + up to $49m in earn outs. A good update which I’ll spend more time on in coming notes (too focussed on reporting today)
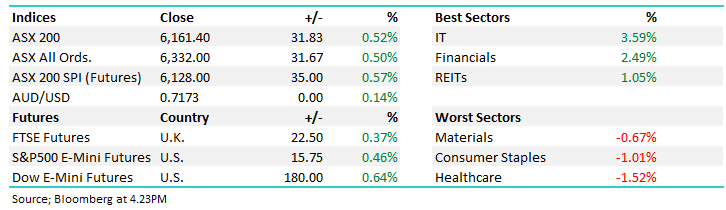
Overall, the ASX 200 added +32pts / +0.52% to close at 6161. Dow Futures are trading up +180pts / +0.64%
LOCAL REPORTING CALENDAR: CLICK HERE **Please note, data sourced from Bloomberg, not all ASX companies are on this list and dates can vary**
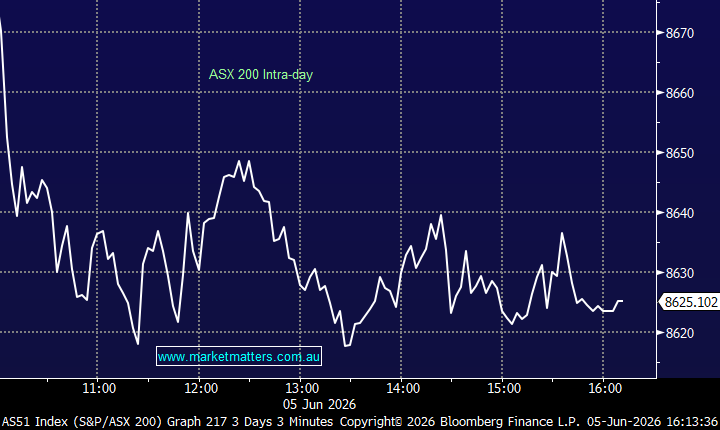
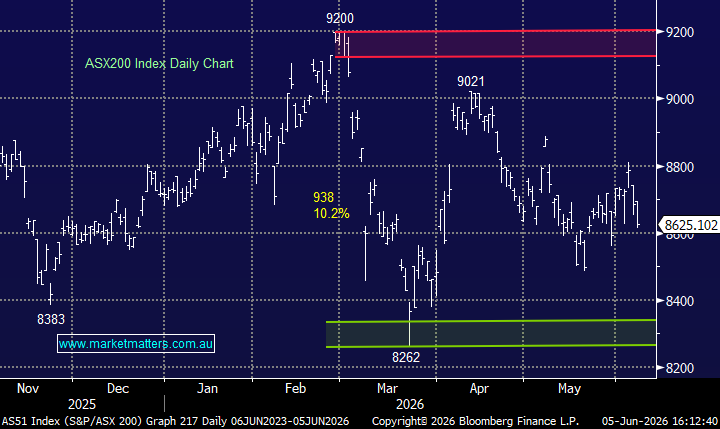
ASX 200 Chart
ASX 200 Chart – building momentum!
CATCHING MY EYE
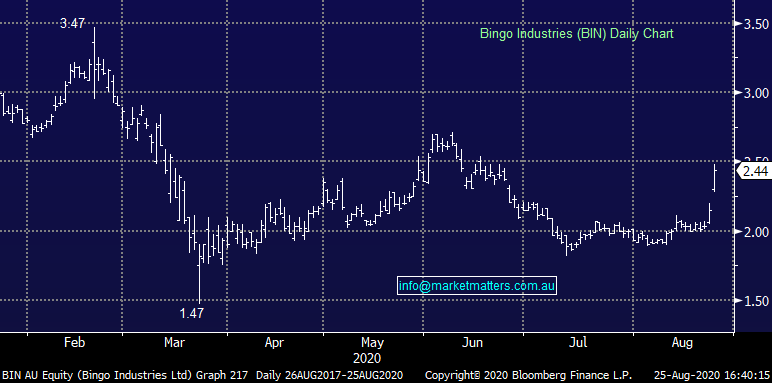
Bingo (BIN) +13.49%: The result I was most concerned about this reporting season dropped today and it beat on all metrics. The bearish thesis was around weak construction hurting earnings, reduced earnings putting pressure on the balance sheet and a forced equity raise the obvious consequence….well, that didn’t happen with revenue holding up while earnings were driven by better synergies coming through from the DADI acquisition. This was a very strong result given the complexities in the current operating environment – they even grew margins. There were a lot who were short / negative this stock hence the pop in share price today.
Here’s their guidance – weak construction, strong infrastructure (no surprises there) “Due to the impacts of COVID-19 we anticipate non-residential commencements may fall by ~20% in FY21 and residential commencements are forecast to reduce by ~15%. However, we anticipate the backlog of projects this will cause will result in a surge of activity towards the end of FY21 and into FY22 and beyond. Infrastructure activity is expected to increase by ~10%. Infrastructure is expected to remain strong for the foreseeable future and for BINGO will partially off-set the softness in the building sector.”
Bingo Industries (BIN) Chart
Western Areas (WSA) -4.53%: the same way BIN hit all the high notes, WSA took care of the low ones, missing on top line, bottom line and every line in between. While revenue was up 15% to $308.4m, it was below the $319m expected while profit of $32m was off the $45.8m forecast. They declared a 1c final dividend taking the full year to…wait for it….2c – why bother! Guidance for FY21 down on FY20, not great but not a disaster. Hard to get excited about this one + the price action today was negative. Contemplating chopping this one.
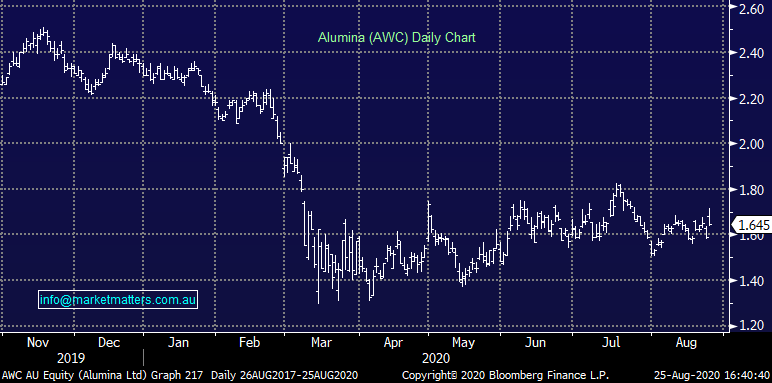
Alumina (AWC) +3.46%: 1H20 result today that was better than expected. Profit was a beat with adjusted NPAT at $88m v $70m expected and this drove a beat to the dividend which came in at US2.8cps. This is what Rocky had to say about it…. Dividend expectations will continue to rise. Post the Alcoa 2Q alumina segment result we noted that the FY20 dividend expectation was ~US2.8c (Stress FY dividend) which would have been in line with our 1H20 expectation … hence big upgrades were coming. We now note that the FY20 dividend expectations is US3.9c, a big hike form the 2.8c from 5 weeks ago but still short of an annualised 1H run rate (>5c). So more dividend upgrades coming and the SP should trade higher as a consequence.
Alumina (AWC) Chart
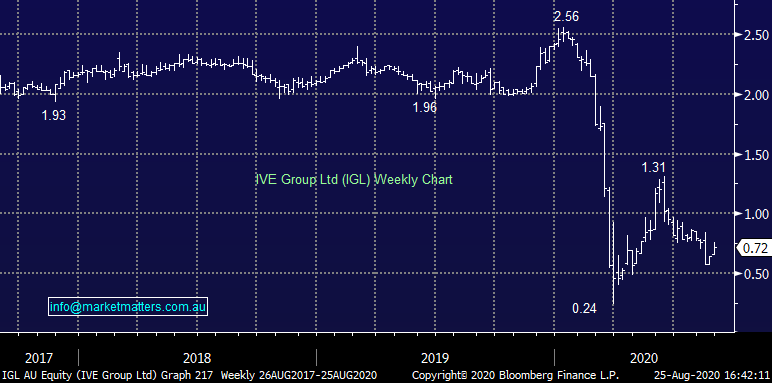
IVE Group (IGL) +6.67%: The thorn in the side of the MM Income Portfolio reported a better full year result today and rallied, but not as much as a I thought it should have, probably because it was a result with a lot of moving parts. Key takeaway = positive, but not as positive as the numbers would imply. Revenue was $691.5m v $679.5 expected driving an EBITDA beat of $76.6m v $70m expected, however there were a few one off benefits in the result today such as jobkeeper that won’t be repeated. In terms of guidance it was strong and worth covering here…there is clearly hope in this turnaround story!
o FY21 underlying EBITDA is expected to be consistent with FY20 / market was forecasting a drop
o Margins to remain stable over FY21
o Forecasting net debt at June 21 to reduce to $110m – a good outcome
o Advising that expects it will resume dividends in 1H21
All in all, a complex result HOWEVER, the cash flow performance is strong, net debt better and management appears to have weathered the COVID storm. A cheap turnaround play.
IVE Group (IGL) Chart
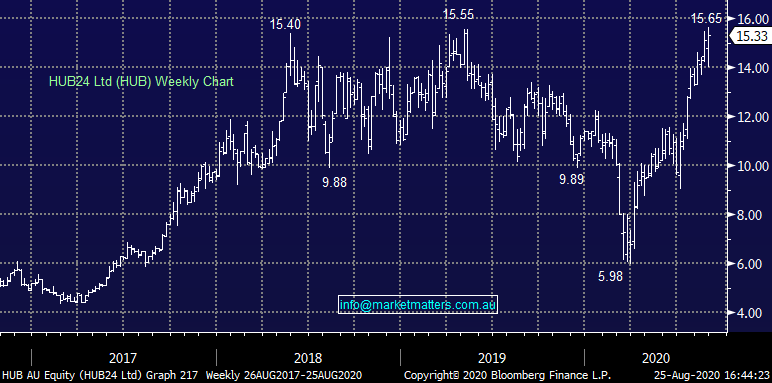
HUB24 (HUB) -1.54%: looked like a small beat to expectations with EBTIDA up 60% to $24.7m, around 4% better than the market expected. Outlook was also solid with FUA already $1b higher than that at the end of the fin year, with a target set for$28-32b by FY22 – though largely dependent on market movements, the target is for a ~70% increase on the $17.4b the platform finished the year with.
The platform battle is one for scale, and HUB is the leader in that respect with the most funds under administration of the independents, and with just 1.9% of the market there is plenty of FUA to capture. Costs were higher though you would expect as much with the company investing to grow and headcount chewing up the bulk of the new expenses, but despite this margin grew more than 6 percentage points. We like HUB – lower today given expectations were high following results from peers. Now at the top of its trading range again.
HUB 24 (HUB) Chart
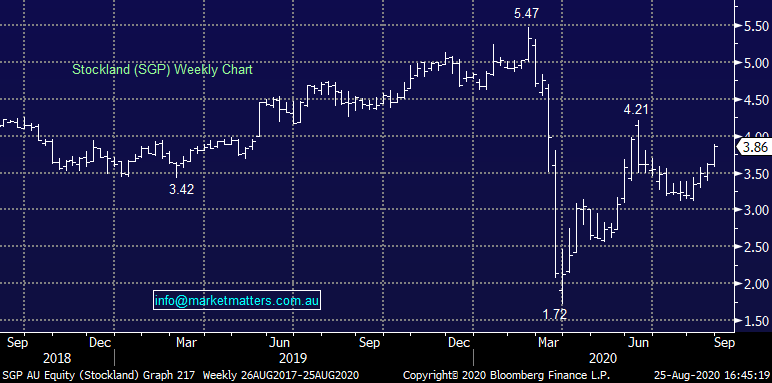
Stockland (SGP) +6.34%: slight beat for Stockland, FFO at 34.7cps around 2% better than market, but 7% below FY19. Helping the dividend come in slightly better than expectations. They saw rent collections drop to 70% in the final quarter, mainly weighed by 61% of retail collections made. The retail book was devalued by ~10% in the second half as well, however office space and logistic centres saw valuations move higher in the period. Residential exposure also weighed on earnings with the default rate jumping to 7% in the final quarter of the year and is expected to remain higher than average while the uncertainty remains. Gearing fell to 25% for SP, right in the middle of the range so it is well placed to pick up assets on the cheap to restock the development pipeline. A good result in a tough situation, or put another way, not the cash crash the market thought it would be, a typical theme in this reporting season.
Stockland (SGP) Chart
Blackmores (BKL) -5.64%: revenues fell, and earnings fell further for Blackmores in a weak result. Profit came in ~3% below expectations today, and well below half on FY19 despite what should have been a strong period given the heightened demand for vitamins. Focus is now on operational efficiency – Blackmores bought a manufacturing facility in the period as it moves from a marketing machine to a more integrated model. They expect profit growth, but the market expects profit to nearly double – more pain to come in our view
Ansell (ANN) -1.94%: market was pretty bullish the protective tackle manufacturer given the tailwinds seen into the end of the year, and the company largely delivered. Revenue was a beat at $1.61b vs the market at $1.56b - this lead to an NPAT beat of 2.5% at $158m. A nice change to see guidance – EPS guidance of $1.26-$1.32cps vs the market at $1.29. Nothing to get too excited over but a solid outcome for Ansell.
Nanosonics (NAN) -9.61%: smoked today, with a top line miss of 6%, dropping down to a big EBIT miss of $11.7m vs the market at $15m. The company does infection control systems, their main product being the Trophon probe disinfector. They said they struggled to grow sales as access to hospitals was limited globally. No guidance here, though the market was already looking for top line sales to grow 25% in FY21. Not for us here.
BROKER MOVES
· MACA Raised to Buy at Moelis & Company; PT A$1.31
· Fortescue Raised to Neutral at Citi; PT A$17.50
· Reliance Worldwide Raised to Buy at EL & C Baillieu; PT A$3.80
· Super Retail Cut to Neutral at Macquarie; PT A$10.80
· nib Raised to Outperform at Macquarie; PT A$5.15
· Afterpay Raised to Overweight at Wilsons; PT A$94.16
· G8 Education Raised to Buy at Canaccord; PT A$1.42
· Origin Energy Raised to Buy at Morningstar
· Fortescue Cut to Underperform at Credit Suisse; PT A$15
· a2 Milk Co Ltd/The Cut to Sell at Bell Potter; PT NZ$19.01
· oOh!media Cut to Neutral at JPMorgan; PT A$1.05
· PWR Holdings Rated New Buy at Moelis & Company; PT A$5.07
· Aspen Group Ltd/Australia Reinstated Buy at Moelis & Company
OUR CALLS
No changes today
Major Movers Today
Have a great night
James, Harry & the Market Matters Team
Disclosure
Market Matters may hold stocks mentioned in this report. Subscribers can view a full list of holdings on the website by clicking here. Positions are updated each Friday, or after the session when positions are traded.
Disclaimer
All figures contained from sources believed to be accurate. All prices stated are based on the last close price at the time of writing unless otherwise noted. Market Matters does not make any representation of warranty as to the accuracy of the figures or prices and disclaims any liability resulting from any inaccuracy.
Reports and other documents published on this website and email (‘Reports’) are authored by Market Matters and the reports represent the views of Market Matters. The Market Matters Report is based on technical analysis of companies, commodities and the market in general. Technical analysis focuses on interpreting charts and other data to determine what the market sentiment about a particular financial product is, or will be. Unlike fundamental analysis, it does not involve a detailed review of the company’s financial position.
The Reports contain general, as opposed to personal, advice. That means they are prepared for multiple distributions without consideration of your investment objectives, financial situation and needs (‘Personal Circumstances’). Accordingly, any advice given is not a recommendation that a particular course of action is suitable for you and the advice is therefore not to be acted on as investment advice. You must assess whether or not any advice is appropriate for your Personal Circumstances before making any investment decisions. You can either make this assessment yourself, or if you require a personal recommendation, you can seek the assistance of a financial advisor. Market Matters or its author(s) accepts no responsibility for any losses or damages resulting from decisions made from or because of information within this publication. Investing and trading in financial products are always risky, so you should do your own research before buying or selling a financial product.
The Reports are published by Market Matters in good faith based on the facts known to it at the time of their preparation and do not purport to contain all relevant information with respect to the financial products to which they relate. Although the Reports are based on information obtained from sources believed to be reliable, Market Matters does not make any representation or warranty that they are accurate, complete or up to date and Market Matters accepts no obligation to correct or update the information or opinions in the Reports. Market Matters may publish content sourced from external content providers.
If you rely on a Report, you do so at your own risk. Past performance is not an indication of future performance. Any projections are estimates only and may not be realised in the future. Except to the extent that liability under any law cannot be excluded, Market Matters disclaims liability for all loss or damage arising as a result of any opinion, advice, recommendation, representation or information expressly or impliedly published in or in relation to this report notwithstanding any error or omission including negligence.