Scanning the HealthCare sector into November
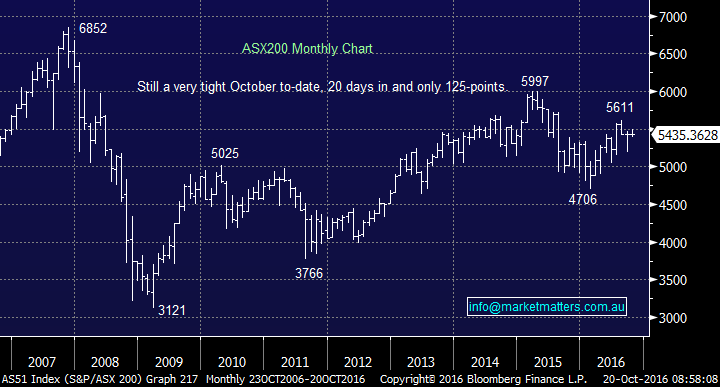
Last night US stocks rallied for a second day with the energy sector up 1.36% and the financials up another 0.9% but again the healthcare sector was a noticeable underperformer falling 0.27%. Markets are continuing to follow their seasonality path i.e. banks very strong in October followed by typical weakness in November, whereas the healthcare sector struggles in October prior to significantly outperforming in November / December. If the banking index is going to satisfy its usually strong October statistics we are likely to see some renewed strength from the anemic ASX200. So far October has seen a very tight 112-point trading range between 5386 and 5498. Remembering the "DOT Theory" a break of either of the two extremes is likely to at least see 125-point follow through if we simply apply the lowest monthly range of 2016 i.e. over 5600 on the upside and ~5250 on the downside.
ASX200 Monthly Chart
While short-term we remain comfortable with our overweight banking position, the question remains do we like any healthcare stocks at current levels remembering that the healthcare sector usually rallies over 4.5% from the end of October for the next 2 months. We only have exposure to CSL Ltd in the Healthcare space consequently today we commence exploring the sector as we consider switching from our overweight banking stance. So far in October the Australian banking sector is +1.9% while the healthcare sector is -1.6% clearly making a potential switch more attractive than a few weeks ago.
US S&P500 Healthcare Sector Quarterly Chart

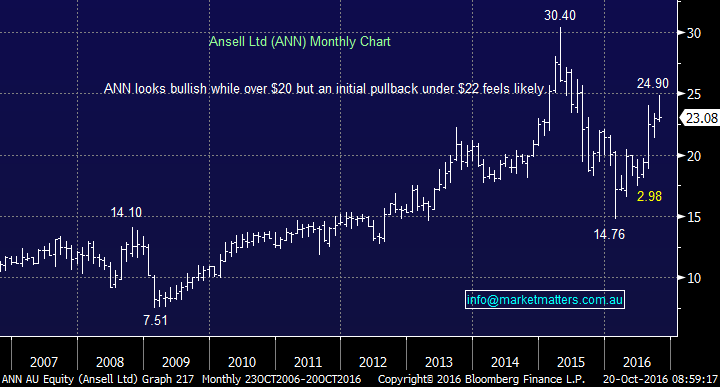
Today we are going to simply look at 3 healthcare stocks on a technical level, with more to follow over coming days. We note that we still anticipate CSL range trading between $100 and $115 into Christmas, hence we have a targeted sell level around 6-8% above yesterday's close. The glove and condom maker Ansell (ANN) has had a very volatile 2016 trading in over a $10 range. This morning ANN reconfirmed earnings guidance for 2017 expecting underlying earnings per share growth of 4-7%. ANN is not overly expensive at present trading on Est. 16.6x 2017 earnings, however with mid-single digit earnings growth over the next 12 months, it’s certainly not deep value either. Technically we are buyers of ANN under $22, with stops under $20. This would be a shorter term positional play if taken.
Ansell Ltd (ANN) Monthly Chart
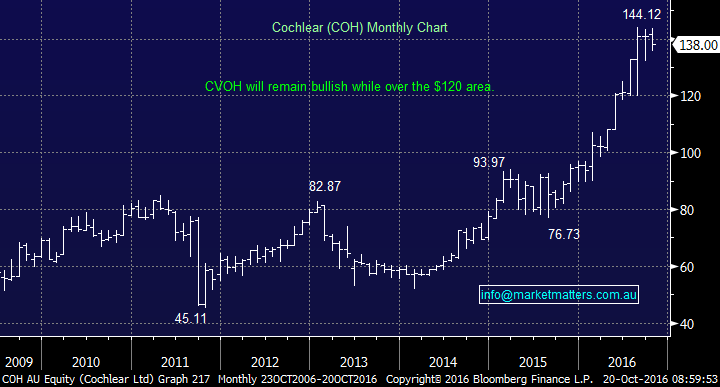
The hearing implant stalwart Cochlear (COH) has enjoyed a fantastic 2016 with the stock gaining well over 30%. The stock surged in August after announcing they anticipated annual profits to rise 20% following a strong 2016. Importantly they expect positive momentum to continue into 2017 from investments made in product development and market growth initiatives. The stock is trading on an estimated P/E for 2017 35x, which is well above its five-year average, hence its priced for good performance - CSL as a comparison is trading on an Est. 29.3x for 2017. Technically currently COH looks good buying around the $130 area, again this would be a shorter term positional play if taken.
Cochlear Ltd (COH) Monthly Chart
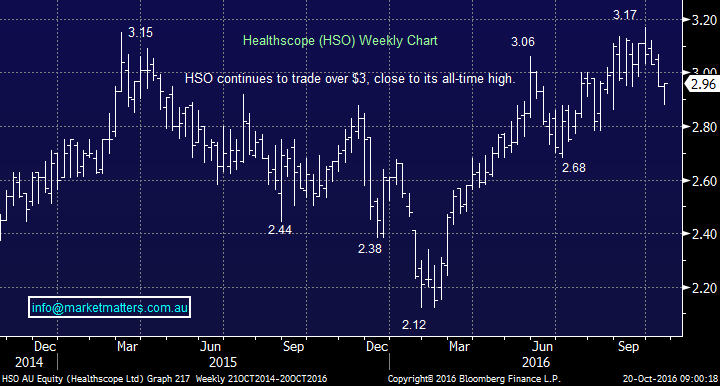
Healthscope (HSO) the Melbourne-based private hospital and medical centre operator plus international pathological services provider continues to trade around the $3 area. HSO is trading at the average end of town for the sector with a Est. P/E of 24.5x 2017 earnings, however, has a very good pipeline of growth project well underway. Technically we prefer the stock under $2.80 before considering.
Healthscope (HSO) Weekly Chart
Summary
Of the 3 healthcare stocks we looked at today, while we consider switching from banking stocks, the below are our 3 simple conclusions:
- We may look to buy ANN under $22
- We like COH around the $130 area.
- HSO would more be attractive under $2.80.
*Watch for alerts*
Overnight Market Matters Wrap
- Stocks in the US closed higher last night after better earnings reports and higher oil prices. The Dow closed up 41 points (-0.2%) to 18,202. The S&P500 was up 5 points to 2,144.
- US Crude hit a 15 month high, jumping as high as 3% during the day after a surprisingly large drop in domestic supplies. US domestic inventories fell by 5.2 million barrels, which yet again kicked analysts’ estimates of a 2.7m barrel increase in inventories out of the park. Crude finished up US$1.13 (+2.2%) to US$51.42/bbl.
- Gold rose for the third day and breached the 200-day moving average amid uncertainty as to when a rise in interest rates will occur. Gold finished up US$7.10 (+0.6%) to US$1,267.90/oz.
- The ASX 200 is expected to open flat this morning, around the 5,439 level, as indicated by the December SPI Futures.
All figures contained from sources believed to be accurate. Market Matters does not make any representation of warranty as to the accuracy of the figures and disclaims any liability resulting from any inaccuracy. Prices as at 20/10/2016. 7.30AM.
Reports and other documents published on this website and email (‘Reports’) are authored by Market Matters and the reports represent the views of Market Matters. The MarketMatters Report is based on technical analysis of companies, commodities and the market in general. Technical analysis focuses on interpreting charts and other data to determine what the market sentiment about a particular financial product is, or will be. Unlike fundamental analysis, it does not involve a detailed review of the company’s financial position.
The Reports contain general, as opposed to personal, advice. That means they are prepared for multiple distributions without consideration of your investment objectives, financial situation and needs (‘Personal Circumstances’). Accordingly, any advice given is not a recommendation that a particular course of action is suitable for you and the advice is therefore not to be acted on as investment advice. You must assess whether or not any advice is appropriate for your Personal Circumstances before making any investment decisions. You can either make this assessment yourself or if you require a personal recommendation, you can seek the assistance of a financial advisor. Market Matters or its author(s) accepts no responsibility for any losses or damages resulting from decisions made from or because of information within this publication. Investing and trading in financial products are always risky, so you should do your own research before buying or selling a financial product.
The Reports are published by Market Matters in good faith based on the facts known to it at the time of their preparation and do not purport to contain all relevant information with respect to the financial products to which they relate. Although the Reports are based on information obtained from sources believed to be reliable, Market Matters does not make any representation or warranty that they are accurate, complete or up to date and Market Matters accepts no obligation to correct or update the information or opinions in the Reports.
If you rely on a Report, you do so at your own risk. Any projections are estimates only and may not be realised in the future. Except to the extent that liability under any law cannot be excluded, Market Matters disclaims liability for all loss or damage arising as a result of any opinion, advice, recommendation, representation or information expressly or impliedly published in or in relation to this report notwithstanding any error or omission including negligence.