That’s why we follow statistics!
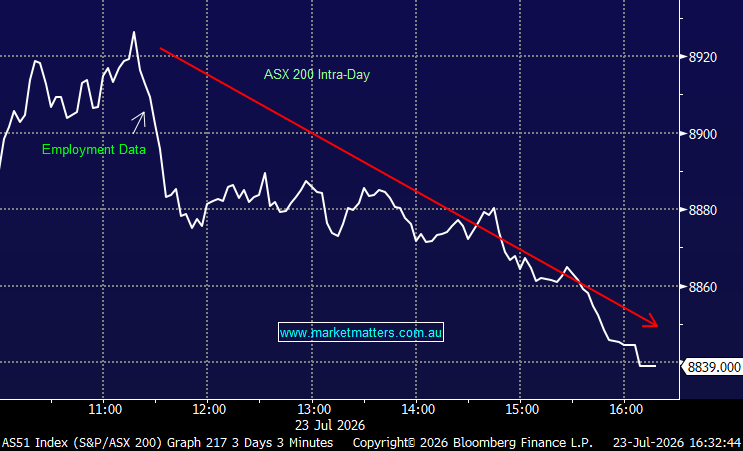
Yesterday our market was hammered another 64-points (1.2%) and suddenly the whole picture for our local market has changed. The Dow remains only 2.7% below its all-time high and 0.8% lower for November BUT the ASX200 is now down 2.6% for October after the last 2 days of aggressive selling. It’s hard at this stage to know why we have been singled out as the market to flee but reasons will probably unfold in time e.g. the $A is up well over 10% from the lows of 2016 and the ASX200 is still up 12% from its low hence for a $US based investor who feels the $A is toppy selling our market aggressively here makes total sense.
Coming back to statistics, we have often quoted the simple but powerful "DOT Theory" that we pay very close attention to: "The DOT Theory simply states that 80% of the time the high, or low, of any time frame will be formed in the first 20% of that timeframe".
This can be a very powerful tool when combined with a market that trades within relatively low degree of error for its trading range of a useful timeframe - for the mathematicians a tight standard deviation of range. Importantly when we applied to this week's ASX200:
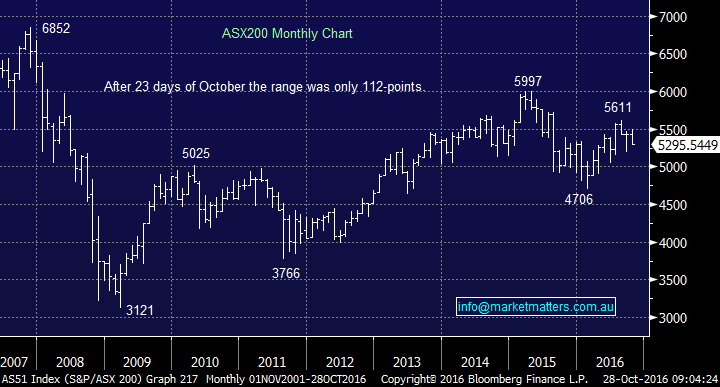
1. The ASX200 has traded in ~250-point range per month in 2016 with a low variance.
2. Until 2-days ago the ASX200 had traded in a very tight 112-point range.
Hence there should be no surprises that when the ASX200 broke 5377 (monthly low) that the selling intensified, an excellent example that statistics should be used as part of an investors toolkit.
ASX200 Monthly Chart
When we focus on the ASX200 after the last 2-days of intense selling our view has transformed very quickly and we are 50-50 split between the below 2 scenarios:
1. The market is now neutral and will rotate between 5150 and 5400 probably until after the US election on November 8th.
2. The market has commenced an impulsive move to lower levels that should see 5150 tested very quickly. Our "GUT Feel" unfortunately is scenario 2 will unfold and if this is correct we should see ongoing weakness over the next few trading days with limited corrections. A close back above 5390 while not our preferred scenario will negate the bearish scenario 2. In our view, it’s very important to have specific levels in mind when increasing/decreasing market exposure.
Seasonal statistics point to a weak few weeks ahead prior to an excellent buying opportunity in late November.
ASX200 Daily Chart
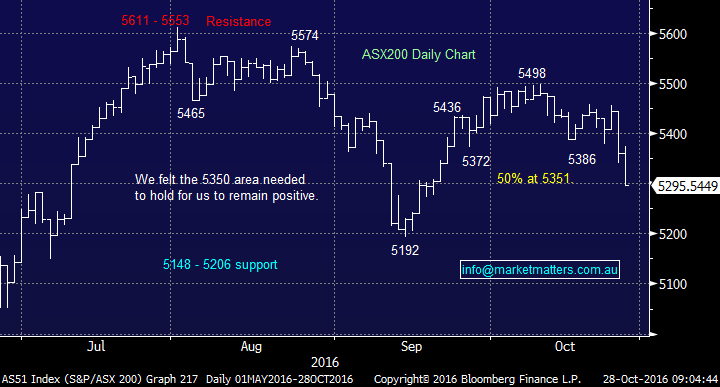
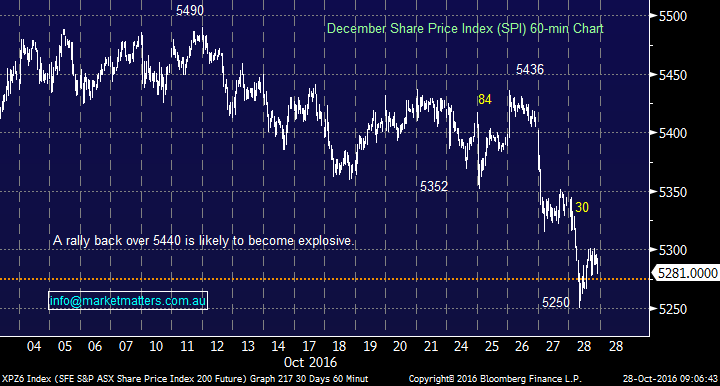
For the traders out there selling a 30-point bounce and ideally an 80-point bounce for lower levels is the suggested approach for initiating shorts.
ASX200 December Share Price Index (SPI) 60-minute Chart
Yesterday we took profit on ANZ Bank and switched half of the funds into Ansell - a strategy we have flagged over recent weeks. ANZ Bank has been the best performer of the "Big 4" over the last month gaining 1.7% while Ansell (ANN) has fallen 4.2% over the same period. As previously discussed we wanted to increase our Healthcare exposure and reduce our Banking position at the end of October, looking for seasonal weakness for the banks in November. We did miss the dividend, however, we feel that protecting capital, increasing cash and reducing our overall exposure to the banks was a more important priority.
Seasonally ANZ is the weakest of the major banks in November and importantly we still hold Westpac and CBA at this stage. In terms of ‘Bellamy’s’ that we have written about recently, yesterday we refrained from purchasing due to our underlying market view.
Summary
We are now neutral / negative the ASX200 until further notice and will be looking to increase our portfolios 14% cash holding.
**Watch for alerts**
Overnight Market Matters Wrap
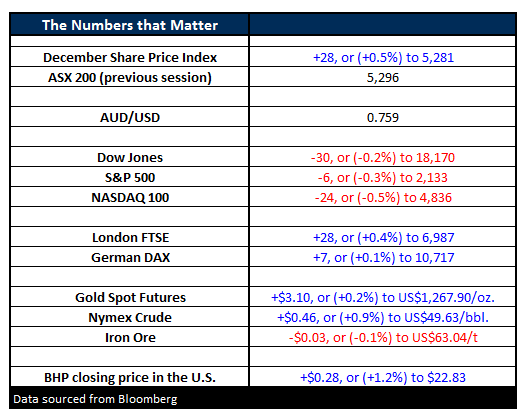
- The US markets closed lower last night with the Dow closing down 30 points to 18,170, whilst the S&P500 closed down 6 points to 2,133. Again the markets close down or up less than 0.2%. As one trader put it, “There’s a lot of activity taking place, but the middle of the rope is not moving”.
- Oil rebounded from a three-day losing streak, managing to rally 0.9% to US$49.63/bbl, a rise of 46c.
- Gold managed a small rise last night, with physical demand expected ahead of the Indian festival week. Gold is traditionally given as a gift during these times. Gold rose US$3.10 (+0.2%) US$1,267.90/oz.
- Iron ore was quieter, dropping just 3c to US$63.04/t
- The ASX 200 is expected to open flat to this morning, around the 5,307 level, as indicated by the December SPI Futures.
All figures contained from sources believed to be accurate. Market Matters does not make any representation of warranty as to the accuracy of the figures and disclaims any liability resulting from any inaccuracy. Prices as at 28/10/2016. 7.30AM.
Reports and other documents published on this website and email (‘Reports’) are authored by Market Matters and the reports represent the views of Market Matters. The MarketMatters Report is based on technical analysis of companies, commodities and the market in general. Technical analysis focuses on interpreting charts and other data to determine what the market sentiment about a particular financial product is, or will be. Unlike fundamental analysis, it does not involve a detailed review of the company’s financial position.
The Reports contain general, as opposed to personal, advice. That means they are prepared for multiple distributions without consideration of your investment objectives, financial situation and needs (‘Personal Circumstances’). Accordingly, any advice given is not a recommendation that a particular course of action is suitable for you and the advice is therefore not to be acted on as investment advice. You must assess whether or not any advice is appropriate for your Personal Circumstances before making any investment decisions. You can either make this assessment yourself, or if you require a personal recommendation, you can seek the assistance of a financial advisor. Market Matters or its author(s) accepts no responsibility for any losses or damages resulting from decisions made from or because of information within this publication. Investing and trading in financial products are always risky, so you should do your own research before buying or selling a financial product.
The Reports are published by Market Matters in good faith based on the facts known to it at the time of their preparation and do not purport to contain all relevant information with respect to the financial products to which they relate. Although the Reports are based on information obtained from sources believed to be reliable, Market Matters does not make any representation or warranty that they are accurate, complete or up to date and Market Matters accepts no obligation to correct or update the information or opinions in the Reports. If you rely on a Report, you do so at your own risk. Any projections are estimates only and may not be realised in the future. Except to the extent that liability under any law cannot be excluded, Market Matters disclaims liability for all loss or damage arising as a result of any opinion, advice, recommendation, representation or information expressly or impliedly published in or in relation to this report notwithstanding any error or omission including negligence.
To unsubscribe. Click Here