Will the seasonals be the tea leaves for 2017?
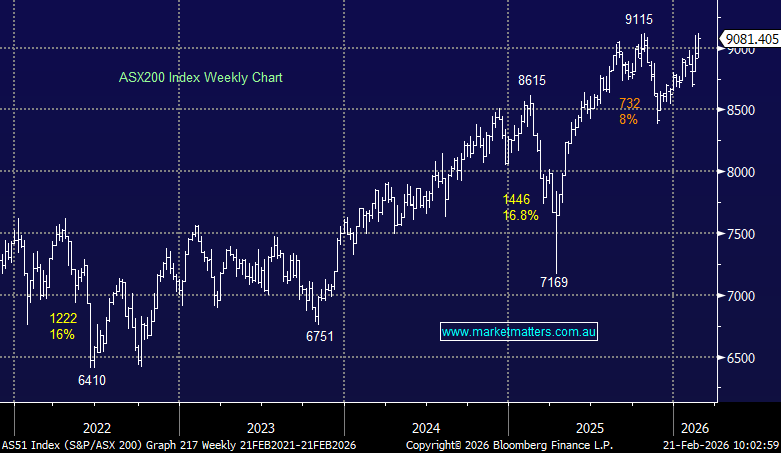
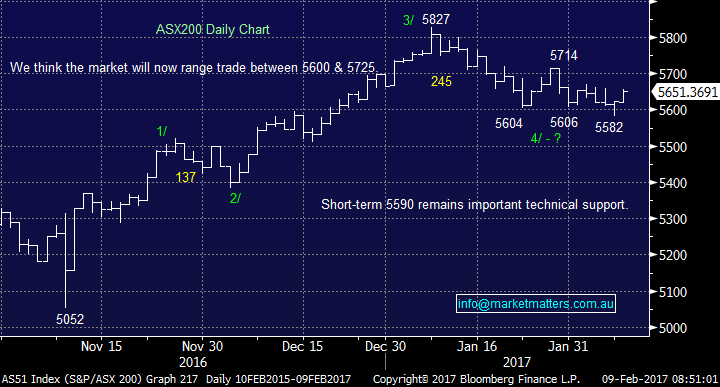
The ASX200 has bounced nicely after its failed attempt to break under the 5,600 level, with yesterday’s company reports aiding the positive sentiment e.g. Seven Group (SVW) +14.4%, Premier Investments (PMV) +11.9% and Carsales.com (CAR) +7.8%. The only real negative on the reporting front was Glenworth Mortgage Insurance (GMA) -14.8%, which fell as mortgage stress increases on Australian property, currently focused in mining areas. While we do not see a local property crash like many "experts", our outlook is definitely on the soft side with any decent increase for property over the next few years extremely hard to rationalize.
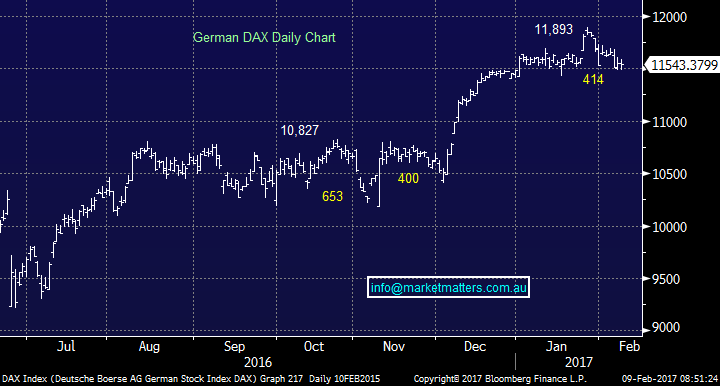
US stocks continue to tread water and although many people have been anticipating a small pullback, including ourselves, no weakness has unfolded, plus more importantly no sell signals have been generated. The German DAX has corrected 3.5%, similar to ourselves, but now look poised to advance over 12,000 i.e. up ~5.5%.
Short-term we still expect the ASX200 to range trade between 5,600 and 5,725.
ASX200 Index Daily Chart
German DAX Daily Chart
We are already into the 6th week of 2017and we have welcomed in both the year of the rooster and Donald Trump, while local stocks have corrected 4.2% from their January high. The question we continually ask ourselves is, where to from here?
When we look at the seasonal swings for Australian stocks the next 3-months are usually excellent for the ASX200, clearly illustrating that a definite reason is required, prior to significantly reducing stock market exposure before the end of April.
ASX200 Index Seasonality of last 5-years
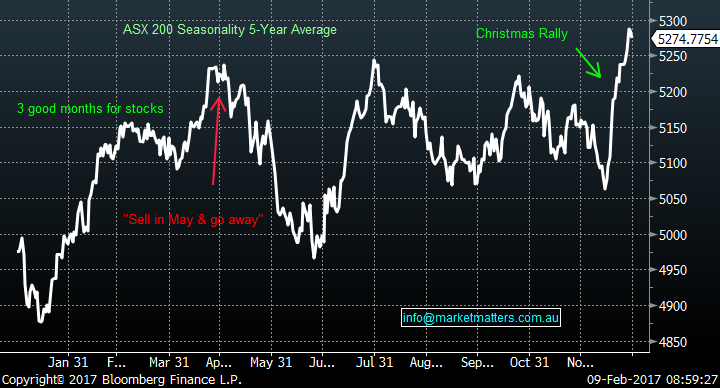
The following statistics for 5 of our largest stocks over the last 10-years, illustrates the seasonal strength from now until May, very clearly on a stock specific level:
- After falling in January / February, CBA has rallied on average 7% in March and April - note most of February’s fall is the dividend.
- Westpac (WBC) who does not pay a dividend in February, has fallen on average 1.2% in January, before rallying a massive 10.2% between February and April.
- BHP has fallen on average 2.3% in January, prior to rallying an impressive 7% between February and April, plus it pays a dividend in March.
- Telstra (TLS) has fallen on average 1.9% in January / February, but like CBA, it pays a solid dividend in February. In March / April, TLS rallies on 4.7% average.
- CSL usually rallies in the first 4-months of a year, before declining 1.5% in May / June.
Simply, the seasonal numbers are telling us we need a solid reason not to maintain a decent exposure to equities until late April.
The last few days’ strength within our market has been noticeably focused in the previously unloved sectors e.g. Healthcare, Real Estate and Utilities. Investors are now waiting to see the impact of Donald Trump's policies, as / when they are implemented i.e. will have on growth and interest rates - we will not get overnight clarity here!
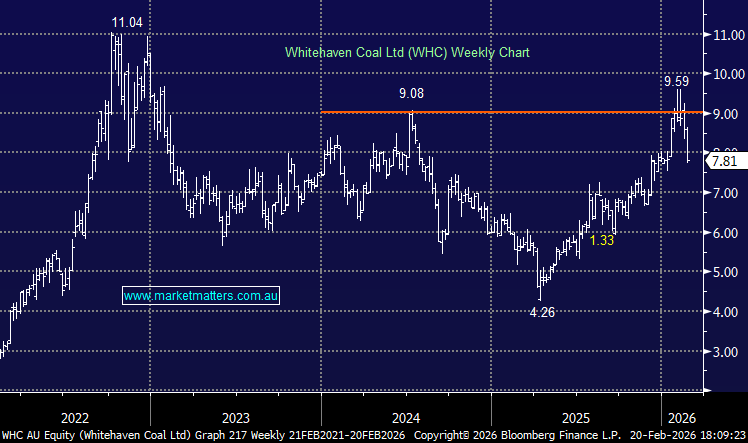
Importantly, if the US shows any signs of slowing, these out of favour stocks can easily bounce hard. After TCL's recent profit upgrade, we will look at 2 stocks that we have been close to over the last 6-months.
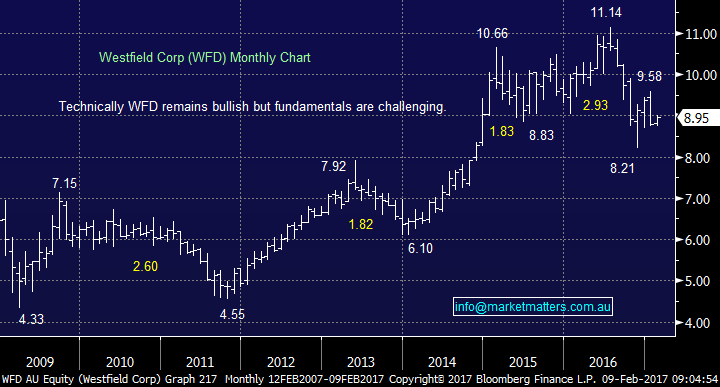
1. Westfield (WFD) $8.95
At the end of 2016 we enjoyed a very nice, but aggressive investment in WFD, buying the stock at $8.50 and selling ~$9.45 in around 5-weeks. We say aggressive, because we see clear risk to the property sector from higher interest rates in the months / years ahead.
However, the stock is now back under $9 and another countertrend rally would not surprise. We will not be dipping our toe in here again, but on balance the stock looks short-term positive, supporting the strong seasonals for the next 3 months.
Westfield (WFD) Monthly Chart
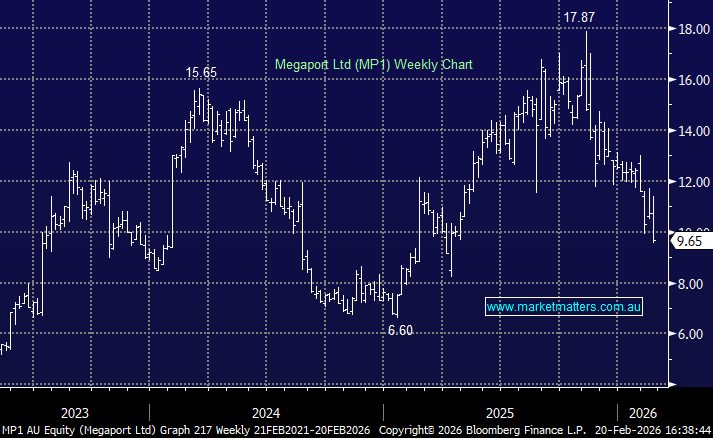
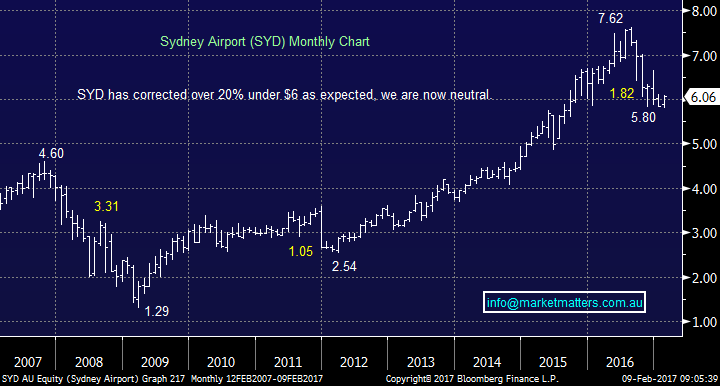
2. Sydney Airports (SYD) $6.06
Unlike WFD and Transurban (TCL), SYD is struggling to get off the floor after falling close to 24%, as the love of the yield trade vanished in 2016. We could see a bounce back towards $6.50 over coming weeks, but this is not a stock we will consider purchasing until further notice but its position does marginally support the seasonals.
Sydney Airports (SYD) Monthly Chart
Summary
Remain cautiously long stocks while no "sell signals" are generated, with the intention of reducing exposure, ideally into strength late April. We are armed with over 20% in cash for potential opportunities that arise during the current reporting / confession season.
We can see the recently unloved stocks continue performing the heavy lifting in the weeks / months ahead.
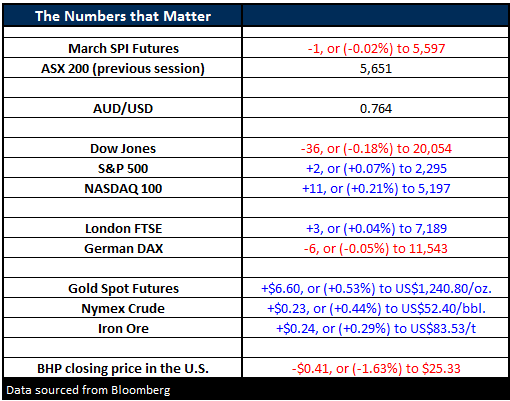
Overnight Market Matters Wrap
- The US Share Indices closed continues to close with little change, with the Dow down 0.18%, the broader S&P 500 up 0.07% and the NASDAQ 100 up 0.21%.
- The US 10 year bonds are at 3-week lows (rates to go up!) while Gold is trading at 3-month highs.
- Of the sectors, the Financials was the laggard, whilst Utilities and REITS outperformed.
- Today, all eyes will be on the performance on RIO after reporting overnight, along with AGL, AMP, HGG and SUN.
- The ASX 200 is expected to open marginally higher, above the 5,650 level as indicated by the March SPI Futures this morning.
Disclosure
Market Matters may hold stocks mentioned in this report. Subscribers can view a full list of holdings on the website by clicking here. Positions are updated each Friday.
Disclaimer
All figures contained from sources believed to be accurate. Market Matters does not make any representation of warranty as to the accuracy of the figures and disclaims any liability resulting from any inaccuracy. Prices as at 09/02/2017. 9.00AM.
Reports and other documents published on this website and email (‘Reports’) are authored by Market Matters and the reports represent the views of Market Matters. The MarketMatters Report is based on technical analysis of companies, commodities and the market in general. Technical analysis focuses on interpreting charts and other data to determine what the market sentiment about a particular financial product is, or will be. Unlike fundamental analysis, it does not involve a detailed review of the company’s financial position.
The Reports contain general, as opposed to personal, advice. That means they are prepared for multiple distributions without consideration of your investment objectives, financial situation and needs (‘Personal Circumstances’). Accordingly, any advice given is not a recommendation that a particular course of action is suitable for you and the advice is therefore not to be acted on as investment advice. You must assess whether or not any advice is appropriate for your Personal Circumstances before making any investment decisions. You can either make this assessment yourself, or if you require a personal recommendation, you can seek the assistance of a financial advisor. Market Matters or its author(s) accepts no responsibility for any losses or damages resulting from decisions made from or because of information within this publication. Investing and trading in financial products are always risky, so you should do your own research before buying or selling a financial product.
The Reports are published by Market Matters in good faith based on the facts known to it at the time of their preparation and do not purport to contain all relevant information with respect to the financial products to which they relate. Although the Reports are based on information obtained from sources believed to be reliable, Market Matters does not make any representation or warranty that they are accurate, complete or up to date and Market Matters accepts no obligation to correct or update the information or opinions in the Reports.
If you rely on a Report, you do so at your own risk. Any projections are estimates only and may not be realised in the future. Except to the extent that liability under any law cannot be excluded, Market Matters disclaims liability for all loss or damage arising as a result of any opinion, advice, recommendation, representation or information expressly or impliedly published in or in relation to this report notwithstanding any error or omission including negligence.
To unsubscribe. Click Here


