Hi David,
A great question which dovetails with the update to our process we sent to members in July here which outlines important indicators.
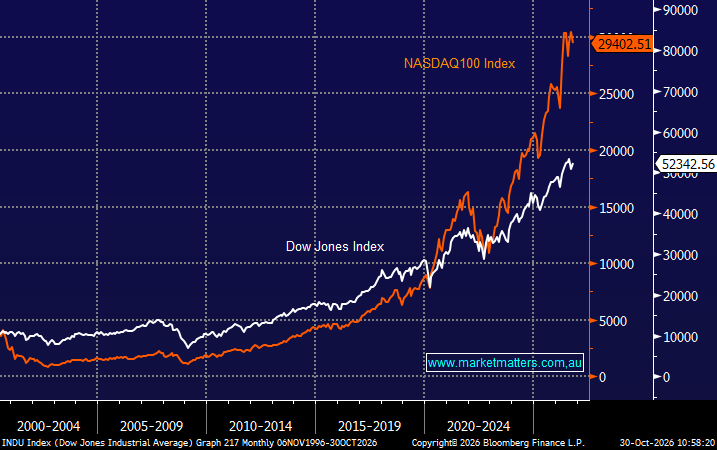
Ultimately, fundamentals and earnings will continue to drive share prices with some macro spice thrown into the mix. To that end, the chart below illustrates how US big tech has dominated gains in the US market since COVID, which mirrors their earnings growth, .
Our observation after ~20 years investing, is that the evolution of ETFs, quantitative & momentum trading has led to more exaggerated moves as positions become crowded and then when investors want to exit, they can often find themselves in the midst of a stampede of sellers. Our process needs to evolve, as you’ve rightly highlighted, based on these changing dynamics.
Therefore, we are now progressively implementing a quantitative overlay to help manage our downside risk, taking some of the human emotion out of cutting all/or part of a position. At it’s core, the system will flag stocks that show outsized moves on the downside that indicate a change of trend in both price and fundamentals. The aim is to keep us away from significant and prolonged re-ratings (lower) in stocks, but not knock us out of positions on market noise. These risk measures need to be wide enough to not whipsaw us out of positions, causing too much trading, but tight enough to avoid large draw downs on individual positions. Our back testing of this tweaked risk management approach is encouraging, but the proof will be in the pudding as they say.