Skip to Content
scroll

Equity Markets price movements

Our Q&As are emailed in our Saturday Morning Report, find the answer to this question below.

The Latest Q&A

Question asked

Equity Markets price movements

Dear Market Matters Team, I am writing to get your insights on the current state of the equity markets, which have become exceptionally volatile. This extreme price action is no longer confined to traditionally illiquid penny stocks; we are now seeing it across the board, heavily impacting major blue chips. The current environment feels reminiscent of the 1980s currency markets, which were often characterised by poor liquidity and less sophisticated trading dynamics. This raises an important question: Is this happening because liquidity constraints and short sellers now have significantly more leverage, especially in a market where potentially investors fundamentally believe equities are overvalued and the future is uncertain? We are currently seeing cases where even a minor miss on reporting expectations can wipe 10–15% (and more in a short time) off a stable blue-chip stock in a single session. What is your team's structural view on why we are seeing such violent reactions to earnings reports, and what specific strategies would you recommend to safely capitalise on these sharp moves? Kind regards, Michael
Answer

Hi Michael,

A very timely question which has certainly added a new dimension to ASX investing – Shawn who was on the old trading floor back in the late 80’s hasn’t ever seen such volatility on the stock level from earnings misses/beats or just simply an analyst’s upgrade, or downgrade.

  • According to Bloomberg 61% of the ASX 200 has seen at least one 10%+ intraday swing this year, and 11% have experienced a 20%+ equivalent move.

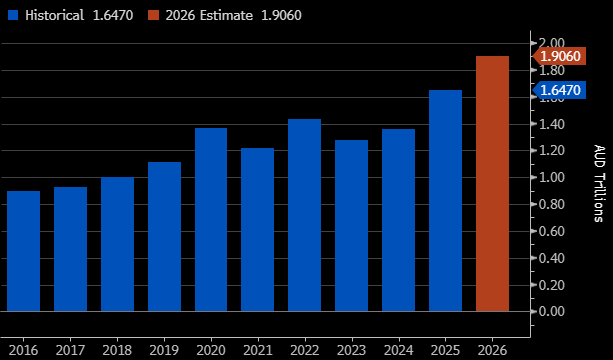
Ironically while the market may feel “thin” 2026 is on track to be the highest-turnover year of the decade, although volatility by definition has help lift this number. We believe the large swings are function of a several changes:

  • Momentum trading is leading to large, crowded positioning which when it unwinds is often sharp and dramatic.
  • Quantitative models have enjoyed a good few years which have led to inflows hence there are more systems getting in & out at the same time.

At MM we believe it’s time to stick to our knitting, using our top-down meets bottom-up model to evaluate and establish positions. However, we are progressively implementing a quantitative overly to help risk management, i.e. to stop losses blowing out on losers.

Overall, we welcome the volatility accompanied by volume, but we do acknowledge it has led to larger P&L swings than we are used to.

chart
image description
ASX 200 Annual Turnover (AUD Trillions)
image description

Relevant suggested news and content from the site

Back to top