Telstra dominates with a weak result – Part 3
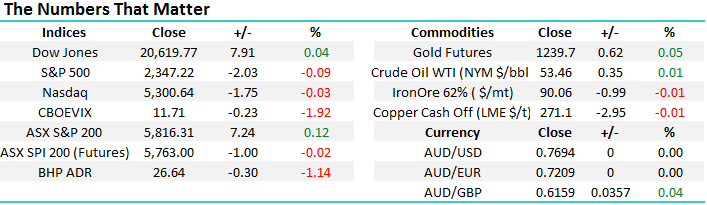
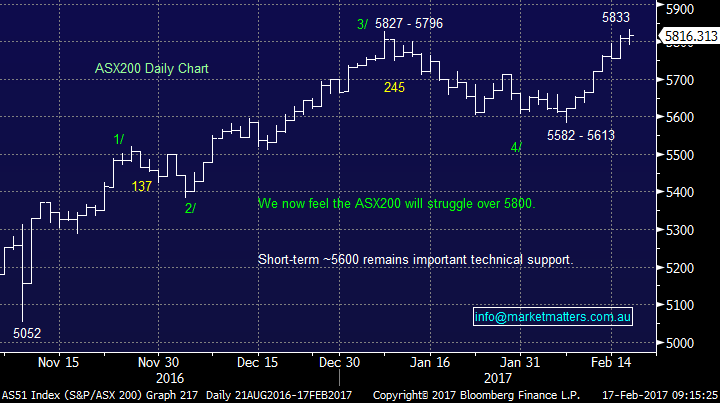
The local market again rallied, but only a relatively small 7-points compared to the previous night's 107-surge by the American Dow Jones. The ASX200 actually spent the majority of the day in negative territory before a late push, primarily by the banks who closed up 0.67%, compared to the overall index which was up 0.16%. Our market is feeling a touch tired after its 251-point rally in just 8-days and barring further strong positive leads from overseas a pullback towards ~5750 feels likely. As expected reporting season continues to dominate the markets swings and sentiment, on Wednesday it was the rally in CBA which added 10-points to the market whereas yesterday it was the battering of TLS which erased 13-points from the ASX200 - more on this later.
Overseas markets are also taking a breath and as we type this report the Dow is basically unchanged as it fights to maintain its longest rally since 2013. The standout to us continues to be gold which continues to grind higher whatever the influence from other markets - we will continue to look for an ideal opportunity to increase our exposure to the gold sector.
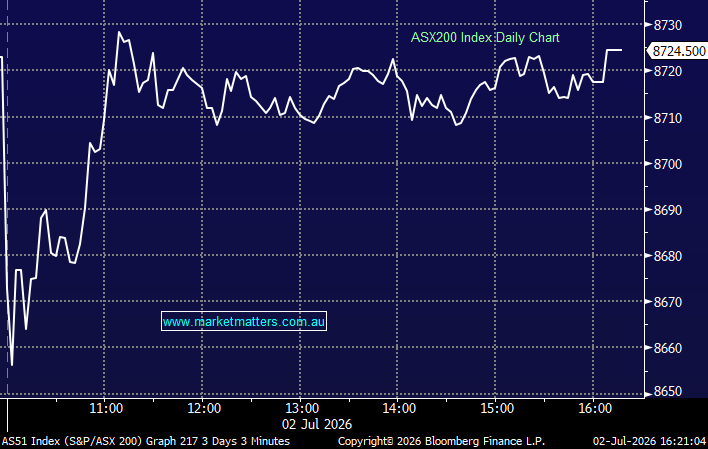
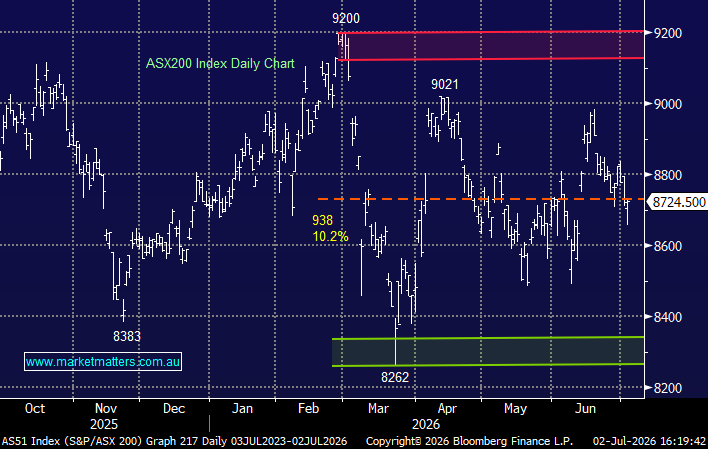
ASX200 Daily Chart
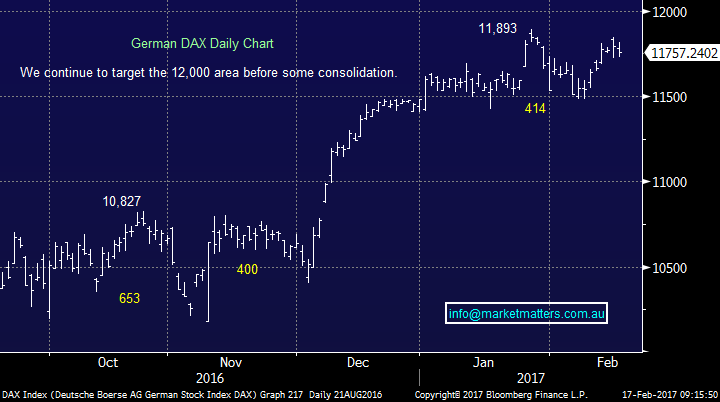
We are continuing to watch the German DAX index closely because it's the clearest technically to MM at present, two things remain prominent in our thoughts:
- We are still targeting the 12,000 area, or ~2% higher, prior a correction to the strong rally since the US election, our best guess is ~5% which is clearly small compared to the 18% rally from the 9th of November.
- Ultimately we still see the DAX rallying to fresh all-time highs ideally close to 12,750 prior to a significant correction but putting things in perspective we are targeting a +25% correction but only potentially another ~7% upside.We continue to believe the bull market since March 2009, which has seen the DAX appreciate 245%, is extremely mature and will correct significantly in 2017/8. Again putting things into perspective we are only looking for the DAX to retrace ~40% of its gains since 2009, nothing excessive considering it already corrected 30% in 2015.
German DAX Daily Chart
Today we will again look at 5 stocks who caught our eye yesterday:
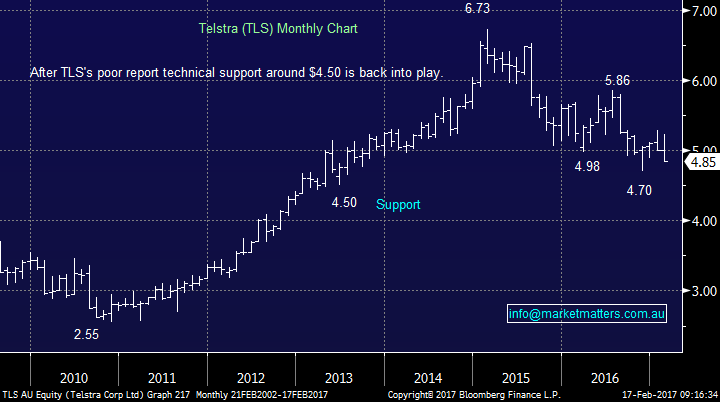
1. Telstra (TLS) $4.85
Telstra is simply not a good company but unfortunately many retail investors flock to the Telco for its 6.4% fully franked yield but they are borrowing around $1bn per year to pay this dividend! Hence it's no surprise TLS has fallen 28% since early 2015.
The main issue with TLS was in its top line trends, or in other words it has very sluggish growth due to weakness in data & mobiles which is also an implication for TPG & Vocus. Mobile service revenue declined by -9.8% with lower margins (40.9% versus 45.9%) as they cut prices to be more competitive while data & IP revenues were down by -4.2%. TLS is the goliath in the room and they managed to do very well in reducing costs which meant that overall earnings were ok. They also maintained guidance saying income will be at the low end of the guidance range for the full year.
Earnings per share for TLS came in (on a normalised basis) at 14.8cps, but they are paying a 15.5cps dividend. They can afford to do it given the lumpy NBN payments totalling about $11bn being paid over the next few years however it obviously highlights the challenges currently faced by the Telco. These NBN payments inflate earnings but the bulk of them end in 2020. Telstra need to reinvest that capital elsewhere to drive future growth, and therein lies the risk (or the opportunity).
We see TLS and the sector as a trading vehicle looking to pick up dividends in the process, but not a buy and hold investment
Telstra (TLS) Monthly Chart
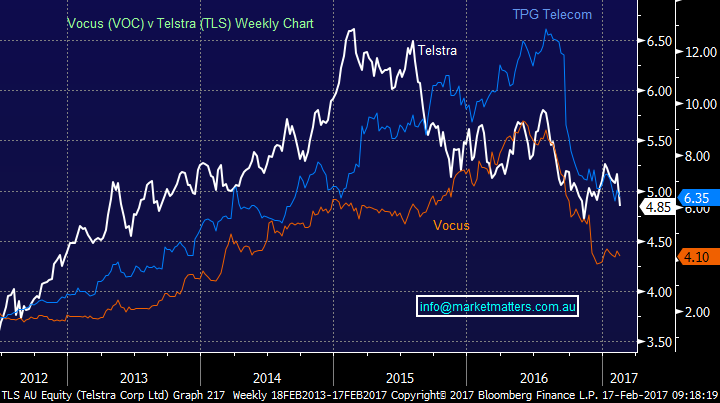
Let's quickly compare the 3 major stocks within the sector, looking at estimated valuations for 2017:
- Telstra has fallen 28% since early 2015 and now trades on a p/e of 14.7x.
- Vocus has declined 57% since June 2016 and now trades on a p/e of 12x.
- TPG Telecom has declined 51% since July 2016 and now trades on an est. p/e of 14x.
There are clear issues within the sector moving forward but also it has been hammered in a comparative manner to the resources sectors into last January....perhaps too much bad news is now built into VOC and TPM, we will give them a little more room but they are on definite watch.
TLS, Vocus and TPG Telecom Weekly Chart
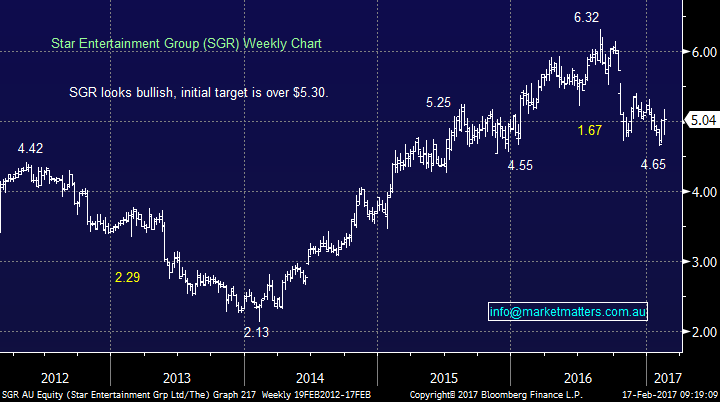
2. Star Entertainment (SGR) $5.04
We hold SGR and yesterday it had a solid result and better overall than the market was positioned for in our opinion. All the things that were expected to hit earnings did, with the Crown debacle hurting VIP and the renovations to Star in Sydney also having a negative impact. That said, guidance was good and trends in the last few months have been positive. This is business that is worth buying into negativity - the clouds will pass and there is a very strong earnings stream underpinning this company. The stock closed up +0.4% to $5.04.
We remain comfortable with our position at least targeting $5.30-$5.40.
Star Entertainment (SGR) Weekly Chart
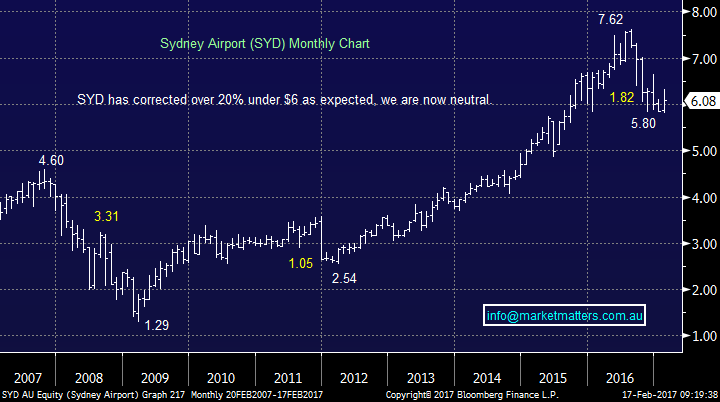
3 Sydney Airports (SYD) $6.08
SYD result yesterday was a beat but the stock again fell back towards the $6 area. We have no problem with SYD as a business but with interest rates rising it's not the place to be invested into 2017 and beyond, especially as there likely to still be many investors who are no doubt long from more painful levels.
We continue to have no interest in the yield play, including SYD, until further notice.
Sydney Airports (SYD) Monthly Chart
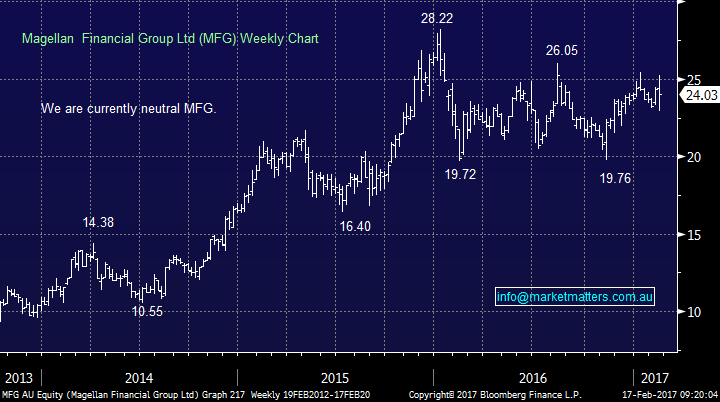
4 Magellan Financial Group (MFG) $24.03
MFG had a solid result versus the markets expectations however if the trends in the business remain negative. Earnings for instance are down 20% on the prior corresponding period as is the dividend. Performance fee ‘s for instance have gone from $40m to around $3m. It was all flagged ahead of time so not a surprise however MFG has not re-rated down to a more palatable valuation. Everything in the market is relative and given the big declines in other fund managers, we think MFG has some catch up to play on the downside.
Magellan Financial Group (MFG) Weekly Chart
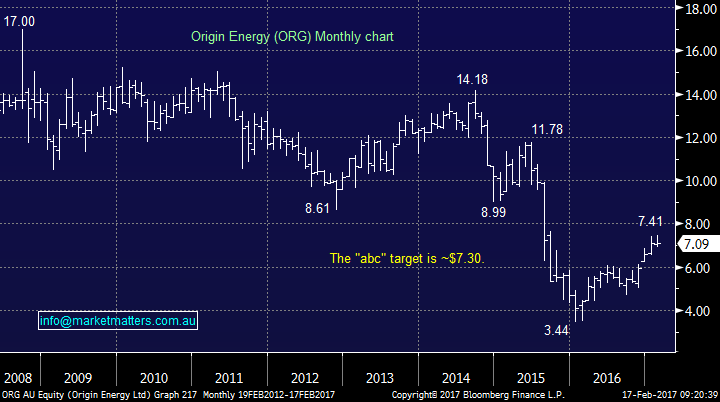
5 Origin Energy (ORG) $7.09
Origin's result was a miss yesterday and as you would expect the stock fell, in this case ~2.2%. We continue to be concerned for the oil sector at current levels with our targets having been reached. Last night crude oil gained 0.6% to close over $US53/barrel but the US oil sector fell over 1%.
We are steering clear of oil stocks at present seeing far downside than upside potential.
Origin Energy (ORG) Monthly Chart
Summary
Not much on the investing / trading front from yesterday but we will obviously be monitoring the Telco's closely.
Overnight Market Matters Wrap
- The US equity markets had a breather from its 7-day streak and closed mixed with little change as the US bank and healthcare stocks lead the declines
- We are likely to follow the US lead with the ASX 200s expected to open marginally higher, testing the 5,820 level this morning indicated by the March SPI Futures.
Disclosure
Market Matters may hold stocks mentioned in this report. Subscribers can view a full list of holdings on the website by clicking here. Positions are updated each Friday.
Disclaimer
All figures contained from sources believed to be accurate. Market Matters does not make any representation of warranty as to the accuracy of the figures and disclaims any liability resulting from any inaccuracy. Prices as at 17/02/2017. 9.00AM.
Reports and other documents published on this website and email (‘Reports’) are authored by Market Matters and the reports represent the views of Market Matters. The MarketMatters Report is based on technical analysis of companies, commodities and the market in general. Technical analysis focuses on interpreting charts and other data to determine what the market sentiment about a particular financial product is, or will be. Unlike fundamental analysis, it does not involve a detailed review of the company’s financial position.
The Reports contain general, as opposed to personal, advice. That means they are prepared for multiple distributions without consideration of your investment objectives, financial situation and needs (‘Personal Circumstances’). Accordingly, any advice given is not a recommendation that a particular course of action is suitable for you and the advice is therefore not to be acted on as investment advice. You must assess whether or not any advice is appropriate for your Personal Circumstances before making any investment decisions. You can either make this assessment yourself, or if you require a personal recommendation, you can seek the assistance of a financial advisor. Market Matters or its author(s) accepts no responsibility for any losses or damages resulting from decisions made from or because of information within this publication. Investing and trading in financial products are always risky, so you should do your own research before buying or selling a financial product.
The Reports are published by Market Matters in good faith based on the facts known to it at the time of their preparation and do not purport to contain all relevant information with respect to the financial products to which they relate. Although the Reports are based on information obtained from sources believed to be reliable, Market Matters does not make any representation or warranty that they are accurate, complete or up to date and Market Matters accepts no obligation to correct or update the information or opinions in the Reports.
If you rely on a Report, you do so at your own risk. Any projections are estimates only and may not be realised in the future. Except to the extent that liability under any law cannot be excluded, Market Matters disclaims liability for all loss or damage arising as a result of any opinion, advice, recommendation, representation or information expressly or impliedly published in or in relation to this report notwithstanding any error or omission including negligence.
To unsubscribe. Click Here