Bubbles are not that uncommon – Part 1
This morning, markets are very quiet as investors try and predict the path for stocks after the FOMC's decision on US interest rates later in the week - the 2 day meeting starts today in Washington. A rate hike is almost a foregone conclusion, the rhetoric which accompanies the interest rate increase is what is likely to move markets e.g. are they going to imply the chance of 4 rate rises through 2017, as opposed to the previously stated 3.
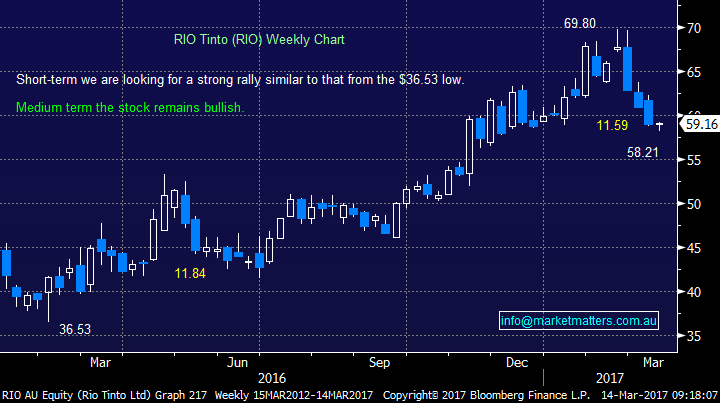
This morning, the ASX200 is set to open up around the 18-points it lost yesterday. The gains are likely to be focused in the resources sector e.g. BHP closed +1.6% in the US even with oil struggling to remain above $US48/barrel. As subscribers know, we have purchased RIO Tinto over the last few days and are now ideally looking for a positive reaction similar to that from the $36.53 low in 2016, when the stock rallied ~$5 after making fresh lows.
With markets likely to be relatively quiet for the next few days, we thought it would be "fun" to look at market bubbles, especially with so many doomsday merchants predicting them - the Australian property market is consistently a favourite target. It's important to mention early in this report that we are not trying to panic subscribers, but just looking back in history for a few clues as to what comes next for the ASX200.
A few quick points:
1. We believe most "crash" style predictions exist to sell newspapers, books, subscriptions etc. Unfortunately bad news sells.
2. Our main goal is to reiterate one of our favourite motifs - investors must remain open minded in today's stock market.
3. We do believe that one important conclusion can be gained from today's brief look at bubbles - see later.
RIO Tinto (RIO) Weekly Chart
Most of us have heard of the Dutch Tulip Bulb Crash in 1636, which is often acknowledged as the first recorded speculative bubble in history - at its peak, a tulip bulb could amazingly change hands at 10 times the annual income of a skilled craftsman. This led to the world's first futures market, which promptly collapsed and the bulbs became all but worthless, bankrupting many people in the process. Sounds crazy we know, but surely so do negative interest rates, which the world has experienced over the last few years.
There have been numerous bubbles over history, but we have focused on 3 simple examples of modern time. We have not bothered with the GFC when local stocks plunged 54% and US property fell ~36% because I'm sure it’s fresh in all of our minds.
Bubbles are simply formed because of human instinct - irrational exuberance getting out of hand as "Fear & Greed" takes over from common sense. We have looked at 3 events over recent history which most subscribers are likely to remember, or at least have read about.
1. Chinese Stock market
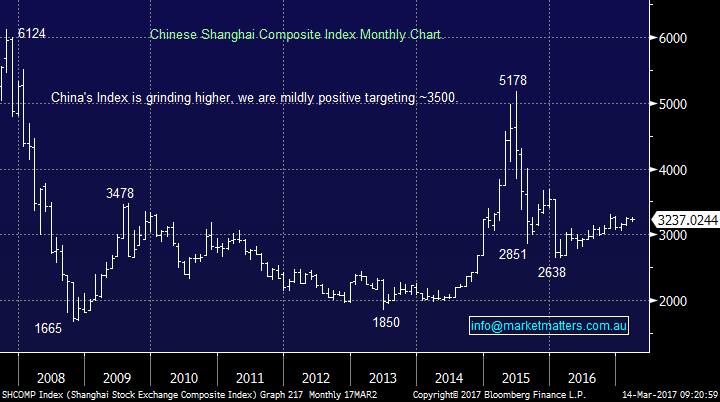
China's stock market has experienced 2 painful bubbles in under 10-year!
1.During the GFC, under 10-years ago, the Shanghai Composite Index fell 72.8% in a single year.
2. In 2015 it crashed again, this time it fell 49% in only 8-months, note this is less than 2-years ago.
A point of note is that Chinese stocks have hardly recovered from the previous craze valuations, the index remains down 37% from its 2015 high. This bubble was formed as investors thought world prosperity would be almost totally China focused and old fashioned P/E style valuations were ignored - sounds a little like our own Bellamys (BAL) and Blackmores (BKL) who have both fallen well over 50%.
It should also be pointed out that there was clearly an enormous degree of local speculation within the Chinese stock market, as people tried to "get rich quick".
The point we are looking to illustrate is the vertical acceleration, in both instances, into fresh highs is the classic characteristic of a blow off top.
China's Shanghai Composite Monthly Chart
2. The Tech wreck of the 1990's
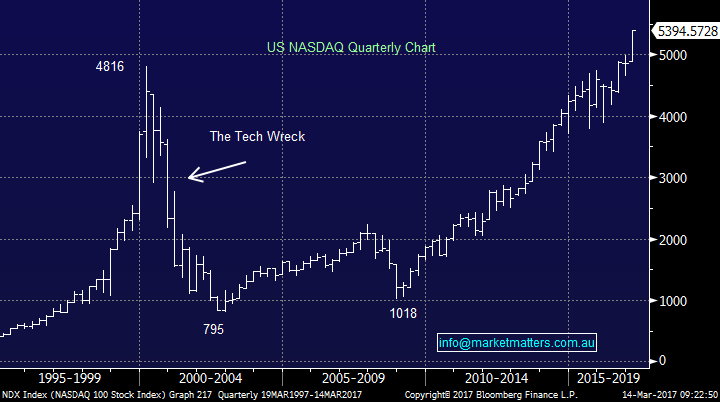
In the 1990's, the US NASDAQ rallied exponentially, before plunging 83% over 2 years in the often called "Tech Wreck". In this instance, the now back in vogue US NASDAQ went berserk as investors leveraged themselves to insane levels to get exposure to the next big thing - the internet. They were correct with the theme, but paid crazy prices for stocks in a new sector when many were doomed to fail, a normal occurrence as new industries evolve - the odds are Tesla will not be at the forefront of electric cars in years to come.
We now have the "FANGS" who are making a fortune from the internet and the NASDAQ is at all time highs - i.e. Facebook, Amazon, Netflix, Google plus APPLE offering some pretty good support. The vertical acceleration into fresh highs is again the classic charteristic of a blow off top and we believe the NASDAQ will again test the 4000 level in coming years - hardly a blip since its rally commenced back in 2008/9.
US NASDAQ Quarterly Chart
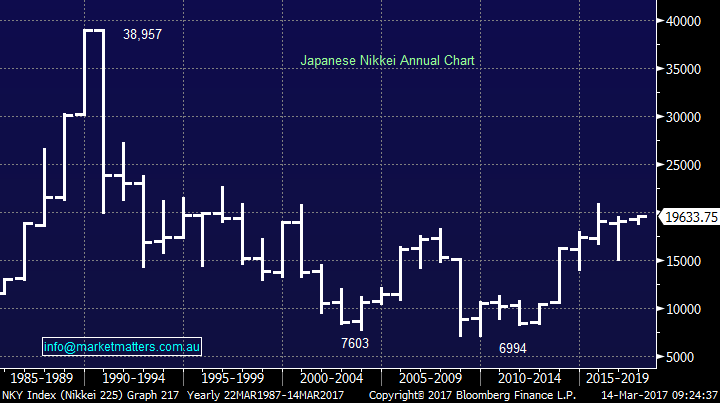
3. The Japanese Stock Market
Lastly in the 1980's, the Japanese stock market rallied, again almost vertically, before plunging over 80% at its worse. Even today the Nikkei remains painfully 50% below the 1989 high, that's over 25 years later! To double the pain, their property market which peaked in 1991 has subsequently fallen ~ 50% to current levels - a clearly tough time for Japan.
This asset price bubble was created by uncontrolled money supply/credit expansion and more specifically by over-confidence and speculation. The recent huge under performance of Japanese assets is often called the lost decade, but I believe you could argue its now over 20 years - not as catchy!
Structurally we cannot see any light at the end of the tunnel, while the Japanese population is both ageing and falling. Economically they need to let foreigners into Japan, but culturally this feels very unlikely at present.
Japanese Nikkei Yearly Chart
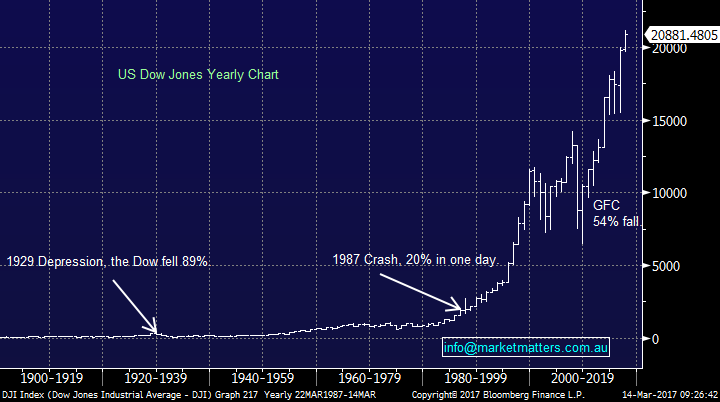
Lastly lets now look at US stocks, on a long term basis, looking out for acceleration to fresh all-time highs, which has been a clear characteristic of the bubbles touched on above.
Two important points:
1. All 3 of the bubbles illustrated above surged a lot higher than many would have thought possible.
2. When they turned, it was a painful reversal that lasted many months.
Undoubtedly the Dow is surging to fresh all-time highs, but it does arguably currently lack the pure acceleration of the 3 recent bubbles illustrated. The US economy is walking a tight rope at present with optimism clearly dominating, we see 2 very clear and yet different risks slowly looming on the horizon:
1. The Fed is forced to raise interest rates too fast for markets to remain happy - the common concern.
2. After a few hikes the US economy quickly struggles and growth diminishes. This scenario is easy to imagine if we consider the unprecedented stimulus that has been thrown at global economies, since the GFC, to avoid a deep recession BUT economies are only ok, there is no boom in sight except in asset prices.
Stocks are currently seeing everything through "rosy glasses" and we believe it's too early to fight this optimism but the time will come because Central Banks are walking on a dangerous path to avoid one of the above points.
At MM we are still targeting a test of ~16,000 for the Dow in coming years - a +25% correction.
US Dow Jones Yearly Chart
Conclusion
Stay long stocks for now, but be prepared to move to cash or put on more bearish positioning in 2017/8.
Overnight Market Matters Wrap
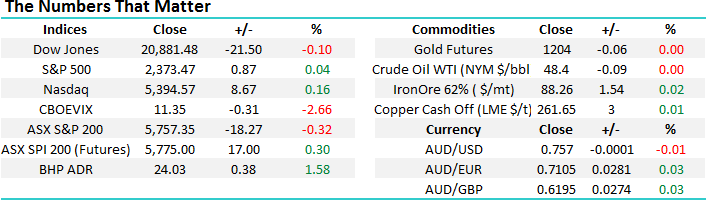
- A marginal mixed close was experienced in the US share markets overnight as investors and traders alike, sit on the sideline anticipating a rate rise when the US Fed officials meet this week.
- The major miners followed Australia’s afternoon lead, with BHP in the US ending its session up an equivalent of 1.58% from Australia’s previous close.
- The March SPI Futures is indicating the ASX 200 to open 19 points higher this morning, towards the 5,775 area.
Disclosure
Market Matters may hold stocks mentioned in this report. Subscribers can view a full list of holdings on the website by clicking here. Positions are updated each Friday.
Disclaimer
All figures contained from sources believed to be accurate. Market Matters does not make any representation of warranty as to the accuracy of the figures and disclaims any liability resulting from any inaccuracy. Prices as at 14/03/2017. 9.00AM.
Reports and other documents published on this website and email (‘Reports’) are authored by Market Matters and the reports represent the views of Market Matters. The MarketMatters Report is based on technical analysis of companies, commodities and the market in general. Technical analysis focuses on interpreting charts and other data to determine what the market sentiment about a particular financial product is, or will be. Unlike fundamental analysis, it does not involve a detailed review of the company’s financial position.
The Reports contain general, as opposed to personal, advice. That means they are prepared for multiple distributions without consideration of your investment objectives, financial situation and needs (‘Personal Circumstances’). Accordingly, any advice given is not a recommendation that a particular course of action is suitable for you and the advice is therefore not to be acted on as investment advice. You must assess whether or not any advice is appropriate for your Personal Circumstances before making any investment decisions. You can either make this assessment yourself, or if you require a personal recommendation, you can seek the assistance of a financial advisor. Market Matters or its author(s) accepts no responsibility for any losses or damages resulting from decisions made from or because of information within this publication. Investing and trading in financial products are always risky, so you should do your own research before buying or selling a financial product.
The Reports are published by Market Matters in good faith based on the facts known to it at the time of their preparation and do not purport to contain all relevant information with respect to the financial products to which they relate. Although the Reports are based on information obtained from sources believed to be reliable, Market Matters does not make any representation or warranty that they are accurate, complete or up to date and Market Matters accepts no obligation to correct or update the information or opinions in the Reports.
If you rely on a Report, you do so at your own risk. Any projections are estimates only and may not be realised in the future. Except to the extent that liability under any law cannot be excluded, Market Matters disclaims liability for all loss or damage arising as a result of any opinion, advice, recommendation, representation or information expressly or impliedly published in or in relation to this report notwithstanding any error or omission including negligence.
To unsubscribe. Click Here