Subscribers questions

No major news over the weekend as Donald Trump and his team "relatively'" quietly licked their wounds following the failed attempt to throw out Obamacare. We remain fascinated to see how markets react to this news after a few days of contemplation. Remember markets often don't do the expected and certainly not what the press predict e.g. the Dow soared after Trump won, it didn't fall after his healthcare bill failed on Friday and this weekend Sydney property auction clearance rates set a new record for 2017.
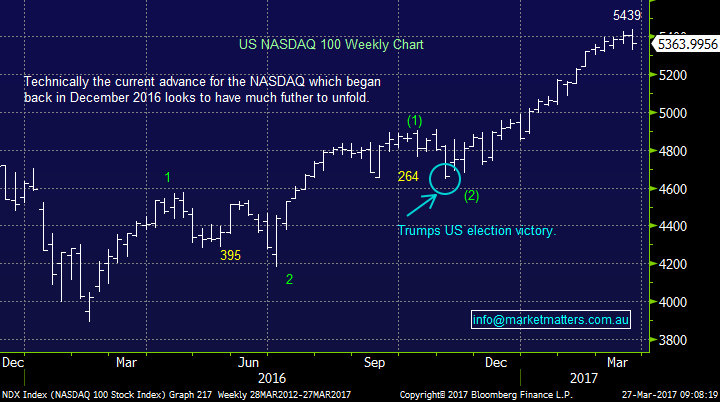
In the weekend report we covered the NASDAQ 100 in more detail than previously because we currently find it the clearest technical chart pattern. The current major 5 companies of the NASDAQ 100, making up a substantial 40% of the index, are Apple, Microsoft, Amazon, Facebook and Google. Hence considering these huge successes of the last decade it's no surprise that we often say that MM believes the NASDAQ leads most global indexes. Currently we see two potential scenarios for the NASDAQ over coming weeks, before it continues higher, potentially towards 6000 and into 2018 - bull markets generally do not do as they are told and roll over when everyone's predicting their imminent decline.
1. The NASDAQ starts a decent correction now, after making fresh all-time highs last week, the target being around 3-4% lower. If the index reaches the 5175 level we believe the bull advance will then resume to fresh all time highs, next stop a test of 5600.
2. The NASDAQ remains bullish and rallies next week towards a seasonal top around early May, prior to a 4-5% correction.
Importantly we remain bullish the NASDAQ and will advocating buying pullbacks for months to come.
NASDAQ 100 Weekly Chart
Question 1
"Now that the Henderson Group (HGG) merger with Janus Group has been mentioned in their reports, could you please shed some light on what is happening plus the likely outcome." - Regards Phil.
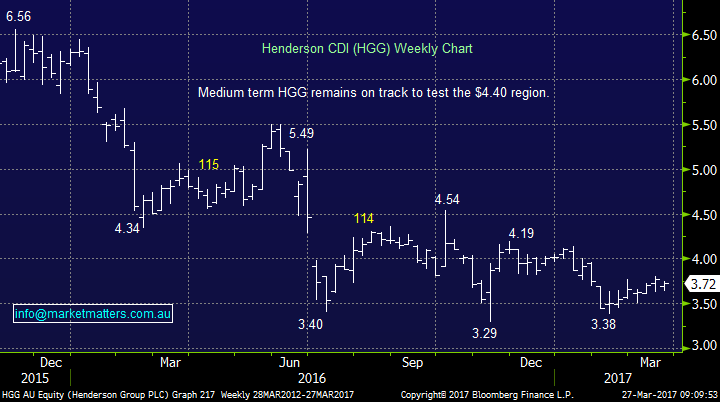
Good morning Phil, a short sentence but very big question, especially as we hold HGG in the MM portfolio. Back in late June, before the BREXIT vote, HGG was trading close to $5.50, but the weakness of the pound and obvious uncertainty has clearly hurt the HGG share price which closed at $3.72 on Friday.
HGG shares have fallen close to 20% in a strong market, since the merger was announced, with the comparative poor Australian history of company mergers weighing on market expectations. Janus / HGG expect to realize ~$80m in net cost synergies by mid 2018 with one-off charges coming in at approx. $125m this year. In 2016 the combined companies Earnings Per Share (EPS) would have been $1.73 paying a dividend of ~14c, on total revenue of over $2bn generating total operating income of just under $500m.
The new merged entity is due to commence trading on the ASX on the 31st of May.
Undoubtedly both businesses have / are experiencing headwinds of investor sentiment towards increasing competitive pressures, poorly performing funds and certain asset classes but we believe this has made the stock relatively cheap, importantly reducing the downside risks from current levels. We are long HGG from $3.82 and remain bullish targeting ~$4.40.
However due to obvious uncertainties moving forward, it is likely to take a while for the market to become fully relaxed with the merger hence if HGG rallies through April we may consider taking all, or part, profit early on this position.
Henderson Group (HGG) Weekly Chart
Question 2
"Thoughts on CYB down at these levels. I see from the releases that JCP have been selling. They have also been selling others stocks. Could be a mandate loss. This means forced selling." - Regards Andrew.
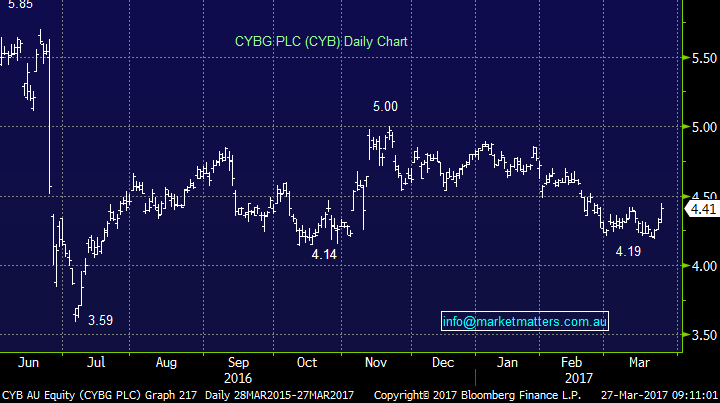
Good morning Andrew, a good question and a stock we have been watching over recent weeks. CYB has risen 11% over the last year compared to 30% by the best performing local bank ANZ. ANZ is now yielding 5.1% fully franked (7.3% grossed up) while CYB is not likely to pay its inaugural dividend until later this year. Hence this spin off from NAB has been shunned by many investors who search for fully franked dividends within the Australian market, the question is has the stock become cheap?
Fundamentally CYB is relatively cheap if management can reduce costs and grow their loan book i.e. 101 banking. We do like the CYB story over the next few years. On the JCP comment, any major share holder exiting a stock, especially when forced selling, can obviously create excellent buying opportunities - at least in the short term.
When we look at the technical picture of CYB it's not very exciting with the stock approaching $4.50 resistance. Importantly as the MM major medium term view for equities is 8-10% higher prior to a major correction of +25% we would rather allocate our investments in local banks to the more traditional "Big 4" who are currently paying excellent fully franked dividends.
CYB feels a better stock to consider when equities have a decent pullback over coming years, given they have plenty of room for improvement in the business independent of what overall markets are doing.
CYBG PLC (CYB) Daily Chart
Question 3
"Thanks MM Team. Great responses to all questions and in particular the one from the grumpy PTM punter. My lesson learnt is never buy professional services companies like SGH nor active management funds that rely on stock pickers who ride up & down in the elevator each day." - best wishes Doug
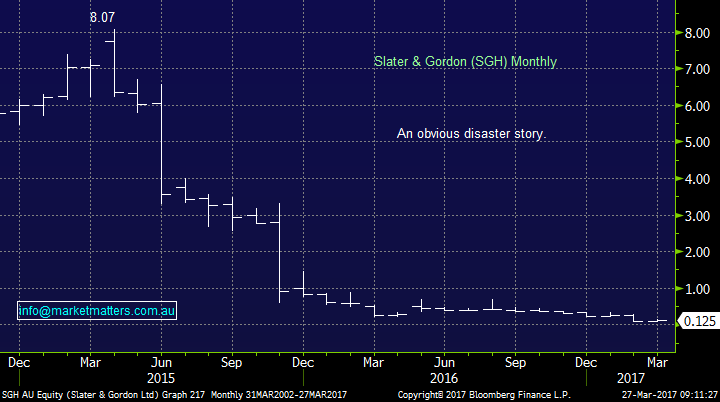
Thanks Doug, compliments are always a lovely way to start the week! WE believe that the SGH story illustrates perfectly why investors should include technical analysis in their tool box. Technical analysis shows how the money flow is effecting a company's share price and importantly people "in the know" are included in this money flow. When we look at SGH technically it was a sell under $7.30 and a runaway under $5.70 - the rapid fall told investors there were deep problems.
Slater & Gordon (SGH) Monthly Chart
Overnight Market Matters Wrap
· The US Markets closed with a marginal mix change last Friday, as all eyes were on the US health care bill.
· US President, Trump’s decision to pull the US health-care bill allows him to focus on tax reform. So, although the health-care bill was seen as a test of Trump’s presidency, tax reform is likely to be far more popular.
· Copper fell slightly as mine workers in Chile ended their strike. Oil was stronger while iron ore fell 1.5%.
· The June SPI Futures is indicating the ASX 200 to open 10 point higher, towards the 5,765 area this morning – however the US Futures this morning currently negates this.
Disclosure
Market Matters may hold stocks mentioned in this report. Subscribers can view a full list of holdings on the website by clicking here. Positions are updated each Friday.
Disclaimer
All figures contained from sources believed to be accurate. Market Matters does not make any representation of warranty as to the accuracy of the figures and disclaims any liability resulting from any inaccuracy. Prices as at 27/03/2017. 9.00AM.
Reports and other documents published on this website and email (‘Reports’) are authored by Market Matters and the reports represent the views of Market Matters. The MarketMatters Report is based on technical analysis of companies, commodities and the market in general. Technical analysis focuses on interpreting charts and other data to determine what the market sentiment about a particular financial product is, or will be. Unlike fundamental analysis, it does not involve a detailed review of the company’s financial position.
The Reports contain general, as opposed to personal, advice. That means they are prepared for multiple distributions without consideration of your investment objectives, financial situation and needs (‘Personal Circumstances’). Accordingly, any advice given is not a recommendation that a particular course of action is suitable for you and the advice is therefore not to be acted on as investment advice. You must assess whether or not any advice is appropriate for your Personal Circumstances before making any investment decisions. You can either make this assessment yourself, or if you require a personal recommendation, you can seek the assistance of a financial advisor. Market Matters or its author(s) accepts no responsibility for any losses or damages resulting from decisions made from or because of information within this publication. Investing and trading in financial products are always risky, so you should do your own research before buying or selling a financial product.
The Reports are published by Market Matters in good faith based on the facts known to it at the time of their preparation and do not purport to contain all relevant information with respect to the financial products to which they relate. Although the Reports are based on information obtained from sources believed to be reliable, Market Matters does not make any representation or warranty that they are accurate, complete or up to date and Market Matters accepts no obligation to correct or update the information or opinions in the Reports.
If you rely on a Report, you do so at your own risk. Any projections are estimates only and may not be realised in the future. Except to the extent that liability under any law cannot be excluded, Market Matters disclaims liability for all loss or damage arising as a result of any opinion, advice, recommendation, representation or information expressly or impliedly published in or in relation to this report notwithstanding any error or omission including negligence.
To unsubscribe. Click Here


