Are the Telco’s next to bounce hard?

Wednesday morning’s report was titled "Stand back and enjoy the market rally" as we targeted 5900, a fresh high since mid-2015, by Friday. Our target was derived from simple range statistics and we think yesterday’s 5899.2 high by the ASX200 is close enough for the bat to be raised!
Our plan remains to increase our cash position into April, so one logical exercise today is to examine the characteristics of trading within April since the GFC. We still believe many fund managers are overweight cash, plus are in the process of receiving over $10bn of dividends, combining this with the begrudging acceptance that stocks are breaking out over 5800, leaves many professionals looking for stocks / sectors to allocate some of their swelling cash reserves - cash is not king when equities rally hard.
Over recent days, we have seen some sharp rallies in the "unloved" stocks as these fund managers look for opportunities where they at least perceive the downside to be limited, especially with takeover rumours percolating nicely in some cases e.g. Aconex, Ardent Leisure, Fairfax, Mantra, Mesoblast and Myer. Later in this report we will briefly revisit the currently most unloved stocks, the Telco's, where as a sector, it is down 32%, while the ASX200 has rallied 17.7% over the last 12-months.
Firstly looking at April in more detail since the GFC:
1. Over the last 8-years, the top for April has been on the 17th, 15th, 11th, 26th, 30th, 29th, 13th and 27th - basically 50% of the time mid-month and 50% at the month’s end.
2. In both 2013 and 2014 when the April top was at the month's end, there was a decent initial top in the middle of the month which was followed by a fall then a recovery, creating a higher high at the end of April - hence 75% of the time we have seen a decent top in mid-April.
3. In 2012 and 2016 when there was a top at the end of the month, the market fell for the first 7-10 days before recovering strongly.
Since the advent of computers, it's not just the conscious that know the general statistics / characteristics of equity markets e.g. most people have heard of the Christmas rally and many know that April is the seasonally strongest month of the year. However, just crunching numbers on a computer can easily miss the internals of a particular market which we believe are vital when looking for optimum returns from your portfolio year after year e.g. the Christmas rally generally starts in the second half of the month.
Having delved into how April usually unfolds, two obvious conclusions stand out to us:
1. Ideally we will look to implement at least 50% of our planned selling by mid April - a mid-month peak makes sense with a large % of the dividends which are hitting investors bank accounts around now are being reinvested into stocks e.g. CBA's large dividend being paid on the 4th of April.
2. If we see a pullback in early April, don't panic, historically it's normally a buying opportunity.
NB Our preferred scenario taking into account the market’s current "breakout" position is we do not see a meaningful correction over the coming 7-10 days, but we must remainmindful that a break of 5800 will generate a technically bearish signal.
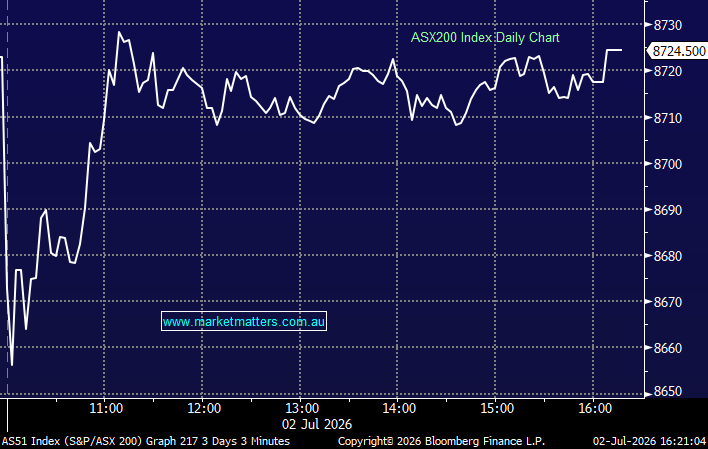
ASX200 Weekly Chart

A number of subscribers have asked why we have not illustrated our view for the Australian market over coming years, similar to how we have with US indices. Hence it is shown below, please don't be scared, if we are correct it willproduce some amazing opportunities for the informed investor.
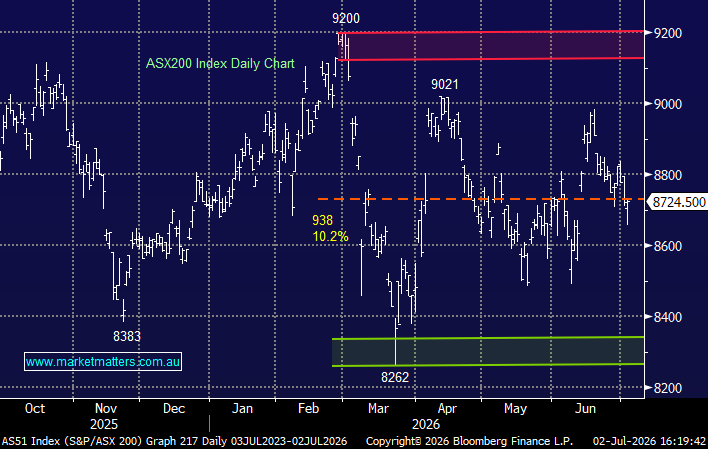
ASX200 Monthly Chart

Overnight, US stocks remained strong rallying around 0.3%, again led by the financials who gained over 1.3% - a good sign for our local bank dominated index. We remain bullish the US Banking Sector, targeting ~10% further gains over coming weeks, another potentially excellent influence for the ASX200. We maintain our target in the 2430 area for the S&P500, ~3% higher, before a reasonable correction as we move into the bearish May-June period. If we are correct and US stocks gain 2-3% from this mornings close then a rally locally to the 5950-6000 region is very realistic.
Our current favourite market index, the NASDAQ, made fresh all-time highs last night which is another good sign for the overall stock markets short-term.
US S&P500 Banking Index Weekly Chart

Finally, moving onto our embattled Telco's who have suffered at the hands of the market’s biggest fear - uncertainty! All 3 Telco's in the ASX200 have endured a shocking 12-month as the forecasting of future profitability becomes very hard due to looming NBN changes e.g. Telstra (TLS) -13.3%, TPG Telecom (TPM) -38.7% and Vocus (VOC) -47.3%. Recent history tells us from both the banking and resources sectors, is that buying sectors when they become totally unloved can be very profitable - the question is will the Telco's follow suit?
1. Telstra (TLS) $4.62 - Telstra is an unfortunate great example of the crowd often being wrong. Retail investors poured into TLS for its undoubtedly excellent yield in 2015, but the stock has subsequently plunged over 30% as future growth and profitability are being questioned, along with potential cuts to its sacred dividend - TLS is currently yielding a tempting 6.7% fully franked. On the dividend front when something looks too good to be true, it usually is! To us at MM, Telstra has become a trading stock, in the same basket as the gold sector, and one we will ideally buy in an attempt to get a "free" short term dividend - the next one is in August. However, TLS can often outperform in periods of market weakness, which we believe is only a few weeks away. Technically TLS looks good in the very short term targeting ~$4.80 but more importantly potentially $5.20.
2. TPG Telecom (TPM) $6.95 - TPM recently had an excellent profit report which initially sent the shares up~8%. However, the current uncertainty around the cost to build a mobile network, and how it will impact earnings over the next 1-3 years, stifled the initial euphoria. Technically we still believe that TPM will rally to the $7.50-$8 region over coming weeks / months but this would be a fairly aggressive play looking for ~10% return.
3. Vocus $4.34 - Yesterday VOC announced further executive departures and after briefly falling, the stock rallied and actually managed to close up 1c - it's usually a bullish sign when a stock rallies on poor news. VOC has remained one of the most shorted stocks on the Australian market for many months with around 11.5% of its stock "sold short", in today's environment this can be a good sign as short squeezes are becoming more prevalent. After plunging 61% since its 2016 highs a bounce / rally over $5 remains a strong possibility but one which we would likely sell into.
We are considering whether our 7.5% allocation in VOC at poor levels should become a 9% spread evenly in each of the major Telco's to both spread the risk and slightly increase our sector exposure - we believe the downside feels very limited in Telco's for now.
Telstra (TLS) Daily Chart

TPG Telecom (TPM) Weekly Chart

Conclusion
We remain short-term bullish equities into April, unless the ASX200 breaks back under 5810 level.
However, we are now wearing our "seller's hat", ideally with the intention of increasing cash levels in the 5950-6000 region.
The Telco sector looks poised to have a 10-15% squeeze higher.
*Watch for alerts.
Overnight Market Matters Wrap
· A positive close across the major indices in the US was seen overnight, after reporting a strong quarterly economic growth data, particularly seen in consumer spending.
· The financial sector outperformed the broader market after benefiting from the data released, while the Utilities underperformed.
· Despite Iron Ore settling 0.57% lower overnight, BHP in the US closed an equivalent of +0.24% from Australia’s previous close.
· The June SPI Futures is indicating the ASX 200 to open 10 points higher, testing the 5910 level this morning.
Disclosure
Market Matters may hold stocks mentioned in this report. Subscribers can view a full list of holdings on the website by clicking here. Positions are updated each Friday.
Disclaimer
All figures contained from sources believed to be accurate. Market Matters does not make any representation of warranty as to the accuracy of the figures and disclaims any liability resulting from any inaccuracy. Prices as at 31/03/2017. 9.00AM.
Reports and other documents published on this website and email (‘Reports’) are authored by Market Matters and the reports represent the views of Market Matters. The MarketMatters Report is based on technical analysis of companies, commodities and the market in general. Technical analysis focuses on interpreting charts and other data to determine what the market sentiment about a particular financial product is, or will be. Unlike fundamental analysis, it does not involve a detailed review of the company’s financial position.
The Reports contain general, as opposed to personal, advice. That means they are prepared for multiple distributions without consideration of your investment objectives, financial situation and needs (‘Personal Circumstances’). Accordingly, any advice given is not a recommendation that a particular course of action is suitable for you and the advice is therefore not to be acted on as investment advice. You must assess whether or not any advice is appropriate for your Personal Circumstances before making any investment decisions. You can either make this assessment yourself, or if you require a personal recommendation, you can seek the assistance of a financial advisor. Market Matters or its author(s) accepts no responsibility for any losses or damages resulting from decisions made from or because of information within this publication. Investing and trading in financial products are always risky, so you should do your own research before buying or selling a financial product.
The Reports are published by Market Matters in good faith based on the facts known to it at the time of their preparation and do not purport to contain all relevant information with respect to the financial products to which they relate. Although the Reports are based on information obtained from sources believed to be reliable, Market Matters does not make any representation or warranty that they are accurate, complete or up to date and Market Matters accepts no obligation to correct or update the information or opinions in the Reports.
If you rely on a Report, you do so at your own risk. Any projections are estimates only and may not be realised in the future. Except to the extent that liability under any law cannot be excluded, Market Matters disclaims liability for all loss or damage arising as a result of any opinion, advice, recommendation, representation or information expressly or impliedly published in or in relation to this report notwithstanding any error or omission including negligence.
To unsubscribe. Click Here