Subscribers Questions
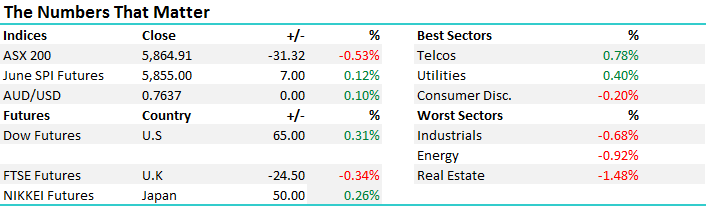
Four pieces of news caught our eyes on the weekend, two nett good for MM positions, and two potentially poor for the overall market. However at 7am this morning the relative calm in the currency markets implies no significant moves are anticipated.
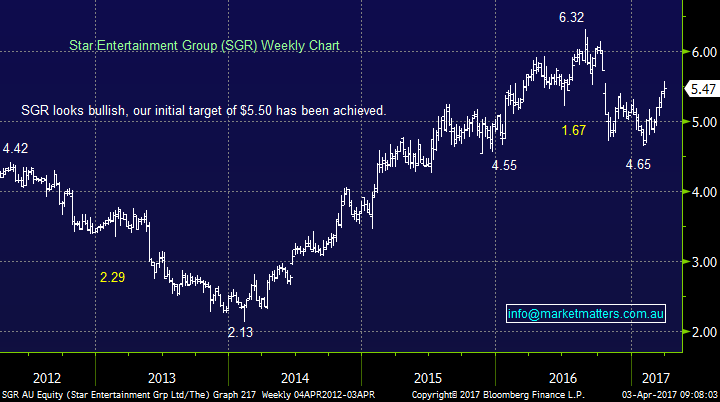
1.On Saturday Macau's Gaming revenue numbers were released and they showed revenue growth in March accelerated at the fastest pace in 8-months, with an increase in both high rollers and leisure gamblers. This would appear to show the internals of the Chinese economy are strong with people from many walks of life having the disposable income plus financial confidence for a "flutter". While our holding in Star City (SGR) is not directly Macau facing if the gamblers are flocking back to Macau they are highly likely to also increase their spend with SGR - an astonishing 30% of Asian visitors to Sydney already visit its casino.
Our initial target for SGR was $5.40-$5.50 but the current momentum and bullish position of other stocks globally within the gaming sector leads us to believe the $6 level is attainable. The position is currently showing an open profit of +17.09%.
Star Entertainment (SGR) Weekly Chart
2. Sydney and Melbourne property markets continued to boom over the weekend with +80% clearance rates in both cities confounding the numerous negative pundits that have emerged over the last 3-6 months. We remain with our view from earlier in the year that while the upside for these buoyant markets may rapidly become limited any major crash we feel is unlikely. The possible exception being with units in places like Brisbane where the supply-demand numbers are very poor over the next few years.
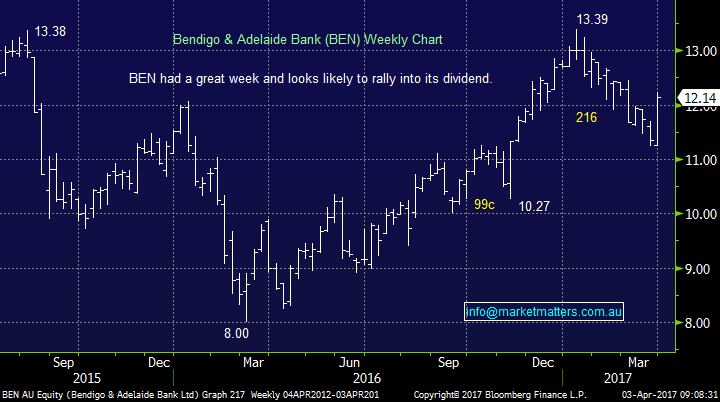
Last week’s resurgence in Bendigo Bank (BEN) after its report shows investors are becoming more comfortable that Australian property is not on the cusp of a crash - BEN is very property dependant. This should be net supportive of our positions in ANZ, CBA and NAB.
Bendigo Bank (BEN) Weekly Chart
3. On Saturday China's central banks raised interest rates on standing lending facility loans, from 3.1% to 3.3%, mainly aimed at small / medium sized financial institutions. Similar to the US, China is following the higher interest rate path due to a stabilised / strong domestic economy. However sometimes rate rises can cause a negative knee jerk reaction within equity markets.
4. Again on Saturday, China's Caixin Manufacturing PMI fell to 51.2 in March from 51.7 in February and importantly below market consensus of 51.5. Basically the activity in China's factories continued to expand for the 9th consecutive month but at reduced momentum raising potential questions around the global economies frailty. However the numbers contrast with the Chinese official factory survey released on Friday which showed activity grew at the fastest rate in 5-years. While these two data releases focus on different areas within the Chinese economy both remain firm but it's a warning that nothing should be taken for granted moving forward.
Question 1
"Hi Guys, Thanks for your great service, continuous insights and your thoughts on equity markets and specific stocks. I have two questions (sorry to be greedy): 1) I have a reasonable exposure to QUB. Everything I read about the company seems to indicate a bright future. In the last 12 months, it has been as high as $2.81 and a low of $2.06. A recent rally sent it back into the high $2.60s but it has faded a little sense. I am interested in your thoughts on the stock's outlook? 2) You have been bullish the US market for some time. I am wondering whether, given this strong view, why you have not invested in a US index ETF?" - Thanks again for an excellent service, David
Morning David, we love questions so do not worry about being greedy!
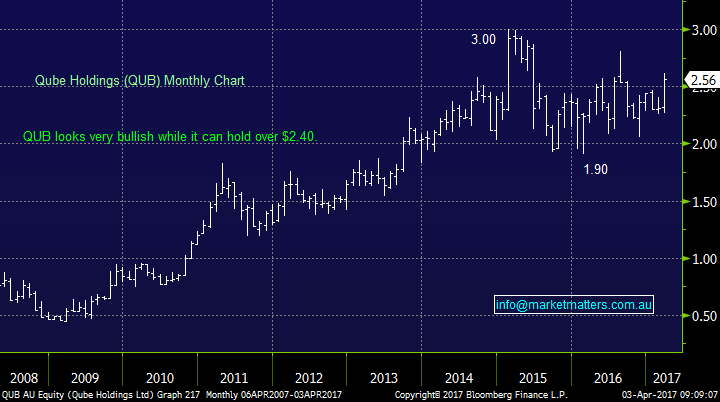
1.Qube Holdings (QUB) is a diversified logistics business that we have followed for many years, no doubt as many did when Chris Corrigan of Patrick fame put his weight behind the company + we also rate the current management very highly lead by Maurice James – whom we’ve met numerous times. Intermodalism is where the growth lies for this business and they have some very good growth projects around the country and the skills / expertise & access to capital to cash in on the increasing movement of goods, and importantly, the changing mix of how goods are transported. i.e more freight being moved long distances by rail before being transferred to trucks to go into metropolitan areas.
In short, we are bullish QUB however this will be a longer term play and for those with patience and tolerance for a low yield infrastructure investment, then it makes sense. From a pricing perspective we initially target a test of $2.80 and then $3, however we would be concerned if the drop fell below $2.40. Therefore we would be advocating staying long looking to commence selling ~$2.80 and $3 if you have a shorter term horizon. Obviously these thoughts do not take into account your personal circumstances.
1.We have looked closely at ETF's (more so in recent times) and clearly one aligned to the Tech. NASDAQ would have been an excellent place to park some funds in 2016/7. We do envisage using ETF's moving forward to gain exposure to our bigger themes especially when we believe stocks are poised to fall and we continue to have concerns around the $US. It must also be remembered that ETFs are structured products so they do come at a cost. The more vanilla, simple ETFs are fairly inexpensive however the more complex ones do have higher fees. Furthermore, at MM we pride ourselves on transparency, telling it how it is, and frankly, it has taken us some time to get comfortable with ETFs given that they are issued by a third party provider.
Qube Holdings (QUB) Monthly Chart
Question 2
"Good morning team, I would like to ask a question around your views on IPH Limited in the medium – longer term. As you know the Share price have halved since the start of 2016 mainly because of concerns around slowing down business activities within the Asia-Pacific region. The estimated dividend yield for financial year 2018 is around 5% (partially franked) and the company’s current PE ratio is around 17. The next announcement will be middle of August where the company is expected to post EBITDA of approximately $70m - $75m. Majority of the brokers share a bullish view on this stock and expect recovery within Asia-Pacific have started already and the median target is $7. Do Market Matters team also share this bullish view on IPH?" – Tianlei
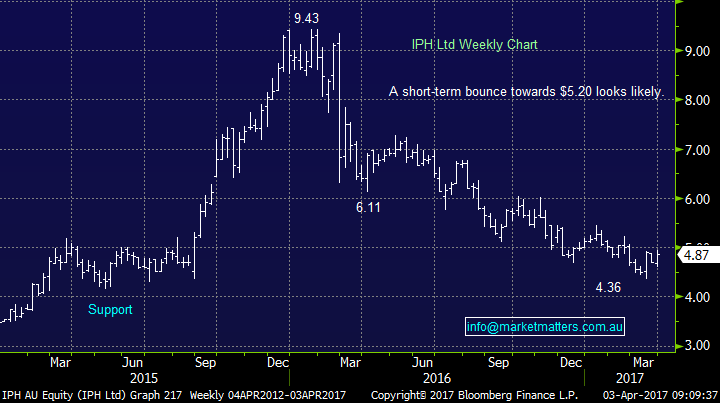
Good morning Tianlei, thanks for another great question. IPH, which is an intellectual property law firm listed towards the end of 2014 to much fanfare as simply, the business had great financial metrics and was loved by many small cap fund managers, largely because it was specialised and was (apparently) so dominant in its sector – which it was at the time. That success however (in terms of financial performance and share price gains) prompted competition to emerge and other companies to list on the market, one example was Zenith IP (XIP). Suddenly it’s growth via acquisition strategy became more competitive and therefore more costly to execute and it struggled. Fast forward to more recent times, shares were sold off in February after its latest results which showed revenue up 22% and profit up 19% to $22.1m. This result was actually okay but the market clearly remains concerned with the IPH strategy of growth from acquisition throughout Asia. All too hard for us at the moment and we see better opportunities elsewhere within the market.
Technically there is good support for the stock under $4.50 and a bounce towards $5.20 looks to be underway but no decent buy signals are currently emerging.
IPH Ltd Weekly Chart
Question 3
"Hi MM, What are your opinions on Nearmap (ASX:NEA)? The share price dropped from around 60c to 45c based on investors' worries about its expansion into America, they have since released an announcement and have subsequently bounced to 54c with good momentum. Is this a buy at these levels?" - Regards Mitch.
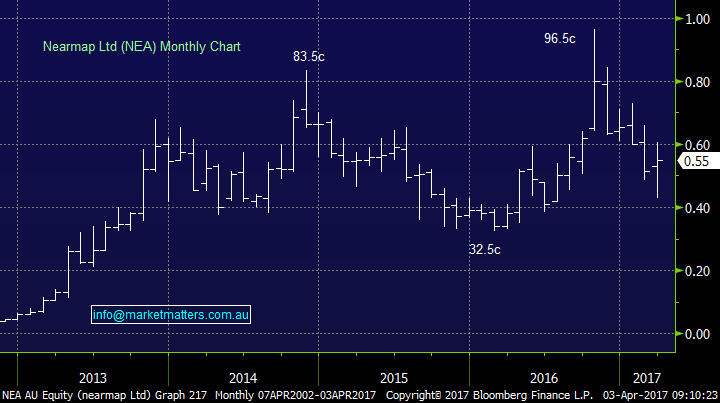
Hi Mitch, thanks for the question on a stock we have not covered previously at MM. Nearmap is a smaller growth stock (market cap. around $200m) and they provide high resolution aerial imagery solutions - NEA then looks to sell these images to businesses, governments etc, mainly through subscription models. We’ve had some exposure to NEA through family businesses that use the technology for engineering and mining related projects – it’s good, saves money and is true to label.
From a stock perspective there are a few issues and that makes it volatile as you’ve suggested. Their expansion in the US has cost more and taken longer than they thought. They have also lost a number of their key people to a new start up, competing with NEA called Spookfish (SFI), which claims to have a lot better tech than NEA. The other competitive threats obviously come from the better known Google maps, who are improving their technology / applications and importantly through the huge rise in drone technology (which is both an opportunity and threat to NEA)
Boiling all this down, it’s hard to get a clear read on the prospects of this business going forward given the external landscape, things that NEA can’t control is so complex. Technically, this is clearly a high risk trading stock having both rallied ~300% and halved in the last 12-months. After the recent bounce we are unfortunately 50-50 just here.
Nearmap (NEA) Chart
Question 4
"Hi, I saw your recent evaluation of various capital notes offerings and noted you considered the most recent Commonwealth Bank offer to be good. However, as it was limited to a max. purchase of $15,000, it was uninteresting for me. Suncorp has just announced a similar offering (sunpf) with no maximum limitation. Could I have your view as to how you evaluate this offer ?" Thanks & best regards Jan.
Thanks Jan. When notes like this are issued there are a number of ways investors can get them, the first of which is through the Broker Bookbuild process, and there is no limit put on this, it just relies on the ability of your broker to acquire an allocation – including the recent CBA notes which we did like and actually list on the market today under code CBAPF – which should open at a premium to the $100 face value today. If you own shares (or other notes) then they will give you access through the security holder offer, however these often have caps on them, and it’s hard to get good allocations.
In terms of the SUN note, which we also like, the company announced a $250m raise, which on the back of strong demand they increased to $300m through the broker book build process. They then open up the security holder offer, however on our understanding, they may only make another $30-50m available here, which is small. You’re best port of call in securing these notes is through a broker in the initial book build process. (James & his team at Shaw can discuss this with you if you’d like).
In terms of the note itself, and without going into too much detail, the structure is the same as recent comparable notes, SUN is a high quality issuer with a good credit rating and the rate they are paying (4.10% over the 90 day) is more than adequate. It’s a small offering ($300m) and the note was many times oversubscribed in the book build process.
Question 5
"Hi Guys, I have a close connection to the energy markets in Eastern Australia particularly. In my view we are witnessing a policy disaster unfolding in the real world with domestic gas prices likely to be double what has producers are earning for their gas exports (before liquefaction and transport). There will be (already unfolding) a reflection of those price increases into the electricity market which is more reliant on gas as coal fired generation withdraws from the market. Then as a result of a fair bit of uncertainty in the renewable area as blackouts start to become a real possibility and Govt has previously talked about ditching the renewable energy schemes investors will be cautious to cover themselves before committing to more generation (which could also Make the situation worse). On 10 Feb in NSW only an aluminium smelter stood between us and a blackout. This has all resulted in extremely high prices in all three sectors and large users are starting to feel the pain but this will spread rapidly as they have to renew their contracts - 6-mths to 18-mths. I am concerned that this has the potential to lead us into a recession as jobs move offshore etc. With prices this high something has to give. I cannot see any normal quick fix and I am not smart enough to predict who or what will fail first but the whole system is like a deck of cards and one unexpected eventuality could cause a cascading reaction unknown in Australia before this. Cheap coal has given us a competitive advantage like it or not. Coal fired generators can't compete with intermittent generation that "has to run" even when the price is $0 per MW. (They still generate certificates worth $80 plus per MW. If jobs go and mortgages can't be repaid, house prices crash, banks go belly up, confidence goes down, dollar goes down, imports go up and so does inflation. Hope all this makes sense. Am I just being too pessimistic? Not sure which companies win in this scenario. I would be interested to know if you have been watching the energy sector or if you have any views on this." - Kind Regards, Peter
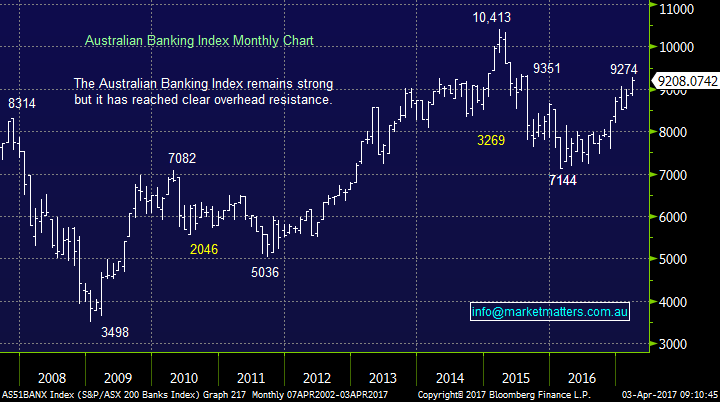
Morning Peter, a long and passionate question and we truly hope you are being way too pessimistic. Unfortunately we have witnessed this style of specific location boom and bust economic cycle throughout history e.g. In Australian the gold rush and recent crash in Iron Ore prices come to mind. Property prices in a number of regions within Australia whose prosperity is driven by resources have fallen by well over 50% since iron ore peaked over $US190/tonne in 2010 prior to tumbling 80% into 2015/6. However the Australian banks remain only 11.6% below there all time highs of early 2015 - to significantly hurt their balance sheets we need to see property prices fall markedly in the likes of Sydney and Melbourne.
There is no doubt that power outages are a major concern to Australia and an issue which has been getting plenty of press coverage for Adelaide / SA but overall we do not believe this will be the catalyst which leads to the ~25% correction for stocks that we are targeting later in 2017 / early 2018.
ASX200 Banking Index Monthly Chart
Question 6
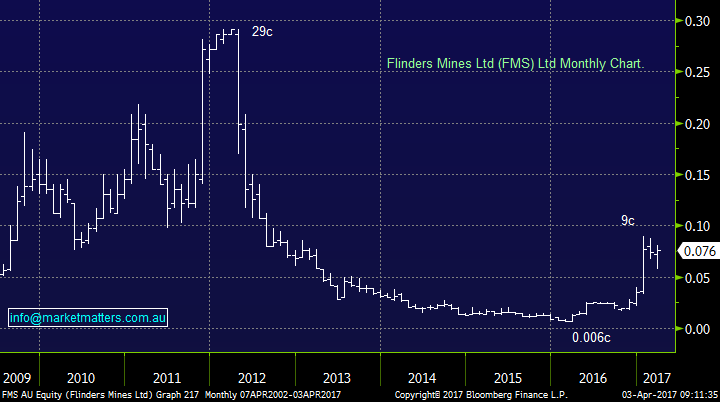
"Hi, I have 2 stocks IRD FMS that have had significant movement upwards and there has been no announcements to back the lift in the share price. Could you have a look and comment?" - Thank you Tony.
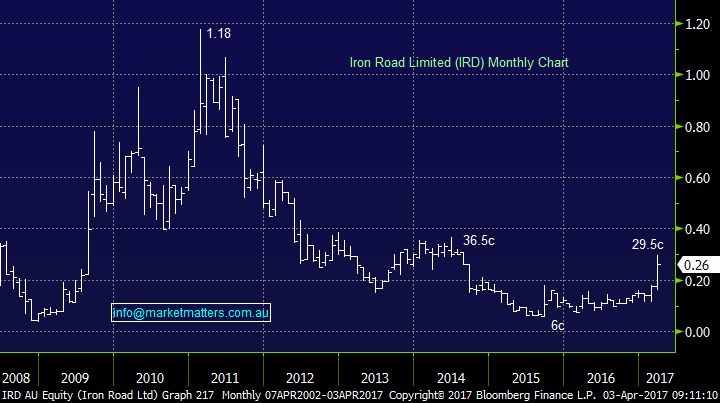
Hi Tony, this is very much at the speculative end of town hence our comments are purely technically based:
1. IRD 26c - IRD has rallied ~50% in the last few months but with significant resistance in the 30c region we would be at least taking part profit if we had bought in the 10-15c region.
2. Flinders Mines 0.076c - This is a casino style stock but technically the chart looks bullish targeting over 10c with stops below the March low.
Iron Road Limited (IRD) Monthly Chart
Flinders Mines Ltd (FMS) Monthly Chart
Overnight Market Matters Wrap
· The US markets had a breather last Friday, with the major indices ending its session lower as a New York Fed member Dudley said the economy is not overheating and that they may start to shrink the central bank’s balance sheet later this year as a substitute for interest rate rises.
· In the commodities sector, Copper fell 2% after Peruvian workers ended their strike. Most other metals on the LME traded lower while iron ore fell.
· Oil rose as reports of stockpiles declined. Production cuts from last year are starting to bring the market into balance.
· The June SPI Futures is indicating the ASX 200 to open 8 points higher, towards the 5,875 area this morning.
Disclosure
Market Matters may hold stocks mentioned in this report. Subscribers can view a full list of holdings on the website by clicking here. Positions are updated each Friday.
Disclaimer
All figures contained from sources believed to be accurate. Market Matters does not make any representation of warranty as to the accuracy of the figures and disclaims any liability resulting from any inaccuracy. Prices as at 03/04/2017. 9.00AM.
Reports and other documents published on this website and email (‘Reports’) are authored by Market Matters and the reports represent the views of Market Matters. The MarketMatters Report is based on technical analysis of companies, commodities and the market in general. Technical analysis focuses on interpreting charts and other data to determine what the market sentiment about a particular financial product is, or will be. Unlike fundamental analysis, it does not involve a detailed review of the company’s financial position.
The Reports contain general, as opposed to personal, advice. That means they are prepared for multiple distributions without consideration of your investment objectives, financial situation and needs (‘Personal Circumstances’). Accordingly, any advice given is not a recommendation that a particular course of action is suitable for you and the advice is therefore not to be acted on as investment advice. You must assess whether or not any advice is appropriate for your Personal Circumstances before making any investment decisions. You can either make this assessment yourself, or if you require a personal recommendation, you can seek the assistance of a financial advisor. Market Matters or its author(s) accepts no responsibility for any losses or damages resulting from decisions made from or because of information within this publication. Investing and trading in financial products are always risky, so you should do your own research before buying or selling a financial product.
The Reports are published by Market Matters in good faith based on the facts known to it at the time of their preparation and do not purport to contain all relevant information with respect to the financial products to which they relate. Although the Reports are based on information obtained from sources believed to be reliable, Market Matters does not make any representation or warranty that they are accurate, complete or up to date and Market Matters accepts no obligation to correct or update the information or opinions in the Reports.
If you rely on a Report, you do so at your own risk. Any projections are estimates only and may not be realised in the future. Except to the extent that liability under any law cannot be excluded, Market Matters disclaims liability for all loss or damage arising as a result of any opinion, advice, recommendation, representation or information expressly or impliedly published in or in relation to this report notwithstanding any error or omission including negligence.
To unsubscribe. Click Here