The Resources Feel Like They Are Awakening From Their Slumber
**Updated Morning Note with Correct Charts
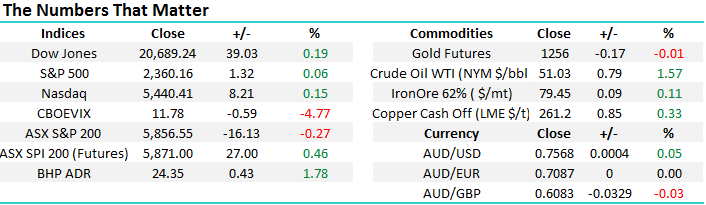
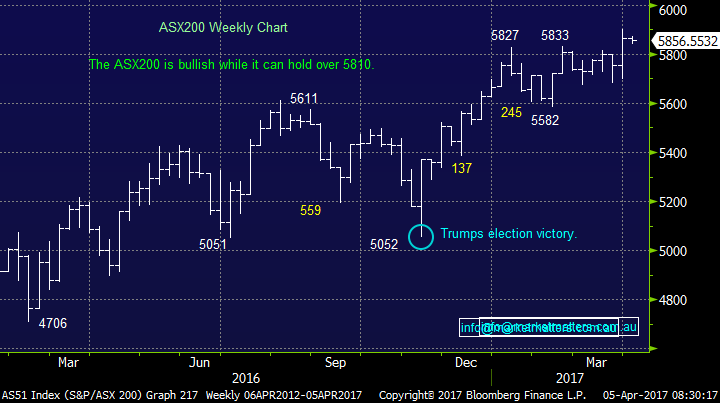
The local stock market has commenced April in a lethargic manner, only trading between 5840 and 5874 to-date. Considering our bullish bias for the coming few weeks, a close over 5875 will lead us to target at least a test of 6000 in the near future. Conversely, a break under 5810 will negate our bullish stance for the short-term. The "DOT Theory" combined with the average statistical ranges for the ASX200 of 110-points per week and 225-points per month, generates this simple extrapolation i.e. if 5840 becomes the low for the week, we should reach 5950 by Friday, plus it if it holds as the low for the month the target becomes 6075!
We remind subscribers that we are wearing our "seller’s hat" at present, ideally looking to lock in some good profits this month into anticipated seasonal strength. It's also very important to remember over 2017/8 that during any 12-month period there is an almost 20% chance that US stocks plunge at least 15%, the last time this occurred was mid-2015, when the S&P 500 corrected 15.2% - we continue to believe a 25% correction is on the horizon, exciting times are ahead!
The DOT Theory: "80% of the time the high, or low, of any timeframe will be formed in the first 20% of the timeframe".
NB If this is unclear to subscribers, please lets us know and we will again explain in greater detail in Mondays report.
While the overall market closed down 0.27% yesterday, the lack of selling in the major resources combined with the surge in gold stocks gave us a "Gut feel" that the resources are ready to bounce well after their last 8-weeks pullback. We committed to this view by finally purchasing OZ Minerals (OZL) as a trade, a stock we have been discussing over the last few weeks.
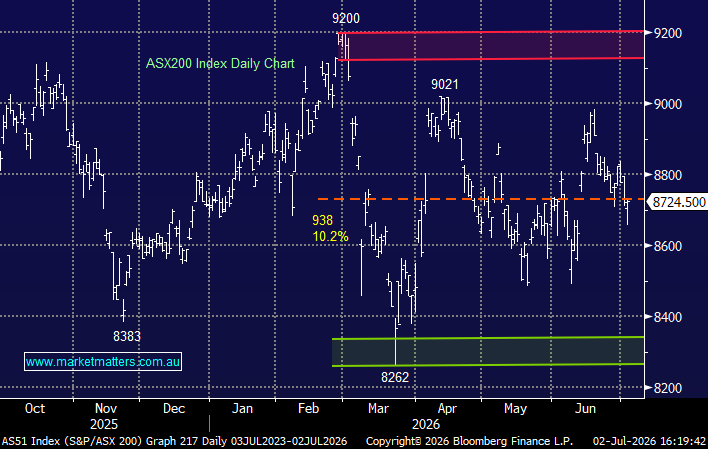
ASX200 Weekly Chart
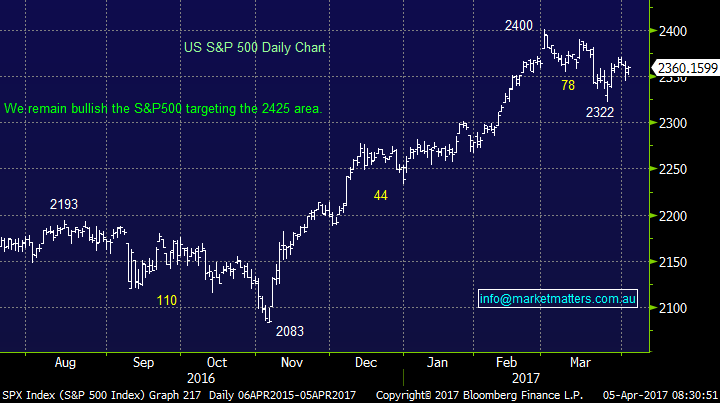
The US market again showed strong resilience to any correction last night, with the S&P500 futures rallying ~0.5% from an early sell-off to finish positive, close to its daily high.This continued rejection of lower levels confirms our short term bullish stance on US equities, we maintain our target in the 2425 area for the S&P500, ~3% higher - before a reasonable correction as we move into the bearish May-June period. If we are correct and US stocks gain ~3% from this mornings close a subsequent rally locally to the 5950-6000 region for the ASX200 is very realistic.
US S&P 500 Daily Chart
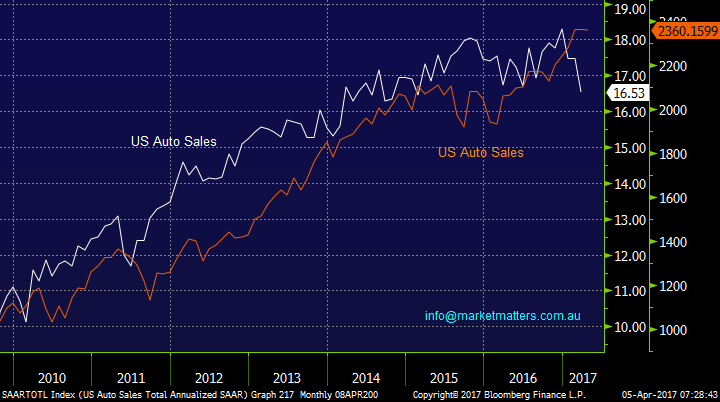
An excellent chart was brought to our attention by Bloomberg this morning, it illustrates the effect of the American economies internal strength on their stocks using US Auto Sales v S&P500. Since the GFC, car sales in the US have enjoyed a buoyant time, but they have started to weaken of late. If this recent weakness continues, it points to a decent correction for US stocks that have been highly correlated to US auto sales since the 8-year bull market commenced.
US S&P500 v US Auto Sales Monthly Chart
Resources
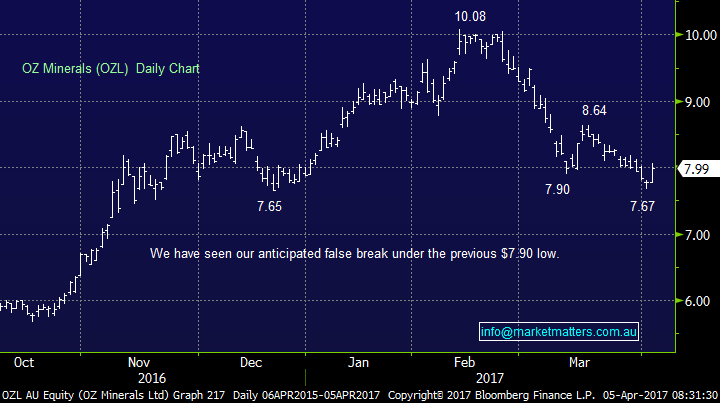
Moving onto the title of today's report and starting with OZL which we purchased yesterday below $7.85, you had to be quick, because after opening at $7.78 the stock recovered strongly to spend most of the day over $8 and finally close up 2.7% - a good effort when the market was weak and copper was particularly weak overnight. We've been stalking this trade in the copper-gold producer for a few weeks and currently our timing feels perfect. While we like resources in general at this point in time, the gold component of OZL's earnings adds extra gloss to our positive outlook for the South Australian miner.
We are now bullish OZL, targeting $8.50 minimum, almost 10% above yesterday’s open.
OZ Minerals (OZL) Daily Chart
When we look at the ideal time to buy a pullback in any stock which we like fundamentally, one of the first things we consider is any previous characteristics of that particular stock.
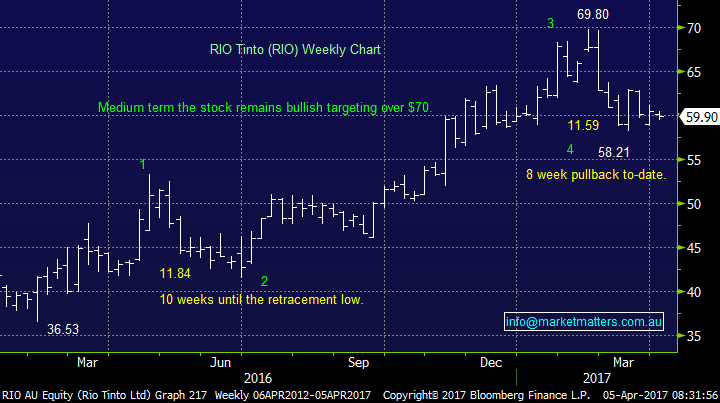
When we apply this to RIO Tinto (RIO) we see the stock corrected $11.84 over 10 weeks in 2016, so far this year RIO has pulled back $11.59 over 8 weeks. That's close enough for us and we are bullish RIO under $60, at least for a bounce towards $65.
RIO Tinto (RIO) Weekly Chart
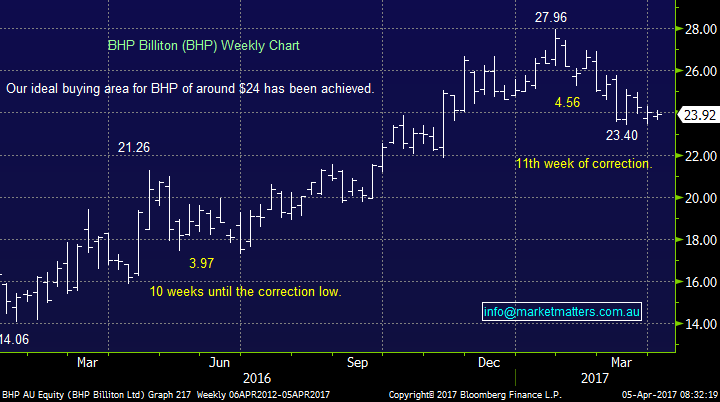
Similarly BHP corrected $3.97 over 10 weeks in 2016, so far this year BHP has pulled back $4.56 over 11 weeks. Again, that's close enough for us and we are bullish BHP under $24, at least for a bounce towards $25.50. We are long both BHP and RIO from good levels.
BHP Billiton (BHP) Weekly Chart
Gold Stocks
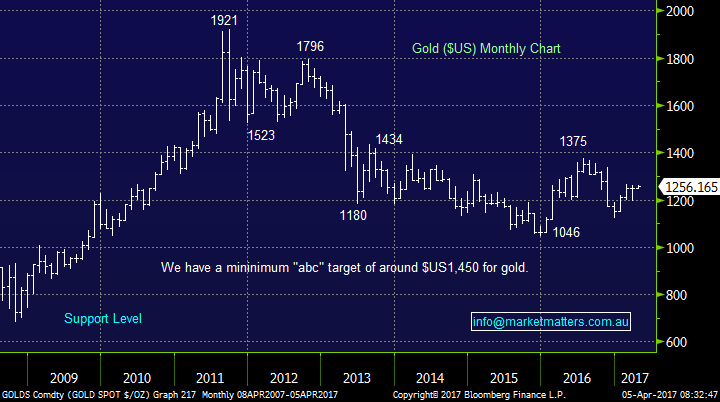
Gold stocks look poised to explode higher with excellent gains in the sector today e.g. Evolution Mining (EVN) +3.8%, Newcrest Mining (NCM) +3.5% and Regis Resources (RRL) +4.5%. Our target for the gold ETF we follow is over 50% higher, which bodes extremely well for our gold exposure via Evolution Mining (EVN) and Regis Resources (RRL), plus the trading position in OZ Minerals (OZL).
Gold ETF Monthly Chart
Conclusion
We remain short-term bullish equities into April, unless the ASX200 breaks back under 5810 level.
However, we are now wearing our "seller’s hat", ideally with the intention of increasing cash levels in the 5950-6000 region.
We remain bullish the resources and especially gold sectors from today's levels.
*Watch for alerts
Overnight Market Matters Wrap
·Some marginal gains returned overnight in the US, paring back the previous day’s loss, as investors remain on the sideline waiting for further data to solidify where the direction of the market should be.
·The Energy and Materials sector pushed the market higher overnight, as Oil climbed 1.57%.
·BHP is expected to outperform the broader market today, after ending its US session an equivalent of +1.78% from Australia’s previous close.
·The June SPI Futures is indicating the ASX 200 to open 33 points higher, testing the 5,890 level this morning.
Disclosure
Market Matters may hold stocks mentioned in this report. Subscribers can view a full list of holdings on the website by clicking here. Positions are updated each Friday.
Disclaimer
All figures contained from sources believed to be accurate. Market Matters does not make any representation of warranty as to the accuracy of the figures and disclaims any liability resulting from any inaccuracy. Prices as at 05/04/2017. 9.00AM.
Reports and other documents published on this website and email (‘Reports’) are authored by Market Matters and the reports represent the views of Market Matters. The MarketMatters Report is based on technical analysis of companies, commodities and the market in general. Technical analysis focuses on interpreting charts and other data to determine what the market sentiment about a particular financial product is, or will be. Unlike fundamental analysis, it does not involve a detailed review of the company’s financial position.
The Reports contain general, as opposed to personal, advice. That means they are prepared for multiple distributions without consideration of your investment objectives, financial situation and needs (‘Personal Circumstances’). Accordingly, any advice given is not a recommendation that a particular course of action is suitable for you and the advice is therefore not to be acted on as investment advice. You must assess whether or not any advice is appropriate for your Personal Circumstances before making any investment decisions. You can either make this assessment yourself, or if you require a personal recommendation, you can seek the assistance of a financial advisor. Market Matters or its author(s) accepts no responsibility for any losses or damages resulting from decisions made from or because of information within this publication. Investing and trading in financial products are always risky, so you should do your own research before buying or selling a financial product.
The Reports are published by Market Matters in good faith based on the facts known to it at the time of their preparation and do not purport to contain all relevant information with respect to the financial products to which they relate. Although the Reports are based on information obtained from sources believed to be reliable, Market Matters does not make any representation or warranty that they are accurate, complete or up to date and Market Matters accepts no obligation to correct or update the information or opinions in the Reports.
If you rely on a Report, you do so at your own risk. Any projections are estimates only and may not be realised in the future. Except to the extent that liability under any law cannot be excluded, Market Matters disclaims liability for all loss or damage arising as a result of any opinion, advice, recommendation, representation or information expressly or impliedly published in or in relation to this report notwithstanding any error or omission including negligence.
To unsubscribe. Click Here