Remember markets do repeat themselves…..
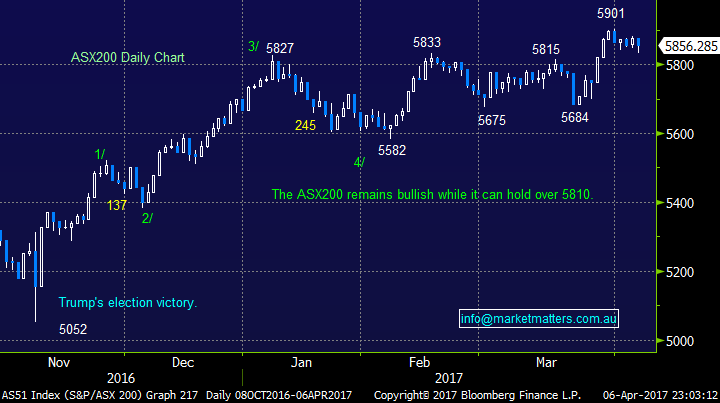
The local market remains range bound, even after attempting a foray to the downside yesterday morning. To-date both the weekly and April range for the ASX200 is 5833 to 5881, a meagre 48-points - statistically a breakout from this range, in either direction, is likely to follow through for at least 100-points. One characteristic of this weeks trading which unfolded again yesterday has been the consistent recovery from intra-day weakness, simply there is plenty of buying into pullbacks, it just varies day to day which sectors are attracting its attention. This unsatisfied appetite for stocks, albeit into minor corrections at present, leads us to the conclusion that the path of least resistance is up and we will test 5950-6000 in April, assuming overseas markets can hold together.
It currently feels like fund managers are almost being forced to buy something but they are concerned by the overall markets valuation, hence they are chasing stocks where they perceive a relatively small risk of "major damage" moving forward, up until recently it was the banks and now it's the likes of CSL Ltd and Cochlear - great companies but not compelling value at today's levels.
We remain bullish the ASX200 while 5810 can hold targeting 5950-6000 this month.
With markets in wait and see mode ahead of the important US employment data tonight, plus the general lack of interest ahead of the Easter break, we thought it was a great opportunity to use today's morning report to illustrate how markets have a common habit of repeating themselves. Markets repeat themselves because they are driven by human emotions which have remained fairly consistent for generations e.g. "Fear & Greed" , hence this information can be used to aid forecasting markets moving forward i.e. Technical analysis. Please note we said aid in our process, at MM we believe technical analysis is a very useful tool when combined with both macroeconomics and the fundamentals of individual sectors / stocks.
Importantly today we will combine this information to simply(we hope) explain how / why we are targeting a ~25% correction in US stocks in 2017/8 but from higher levels.
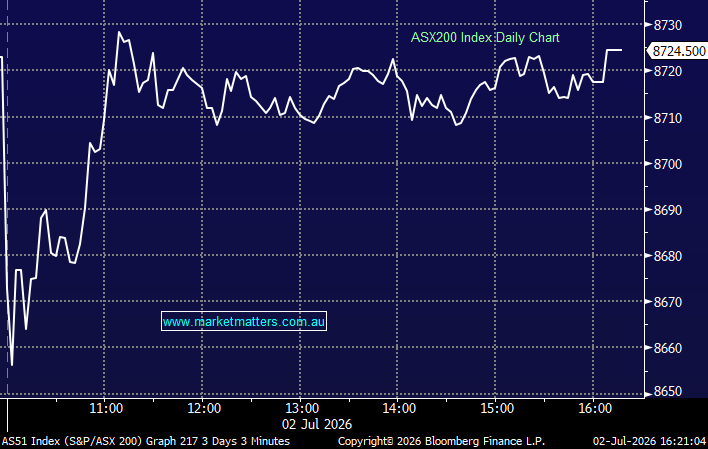
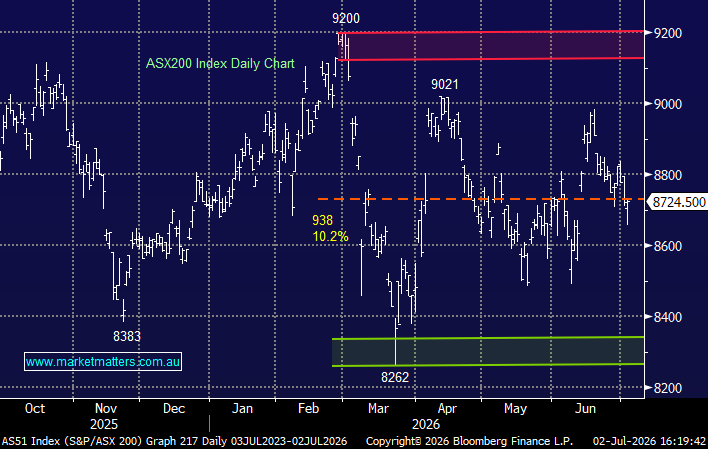
ASX200 Daily Chart
Symmetry Waves
We use Symmetry waves when looking for an opportune area to stand up and buy a correcting market, today we will illustrate 3 very clear examples, all of which we have utilised in some manner - any correction within ~20% we regard as symmetrical but very often the degree of similarity is much, much closer.
1. S&P500 Banking Index
Traders in the US have for now switched their "bets" that the Fed will slow its future path of interest rate hikes as it also looks to shrink its balance sheet moving forward - it feels like the Fed is walking on a gymnasts beam but the goal is a very logical one. This change / tweak in view around rate increases has led to the recent +10% pullback in the US banks. However the US economy is currently robust and rates are still set to rise, hence we believe that investors simply got a little ahead of themselves with chasing the banks who enjoy a higher interest rate environment and optimism will soon return to the sector.
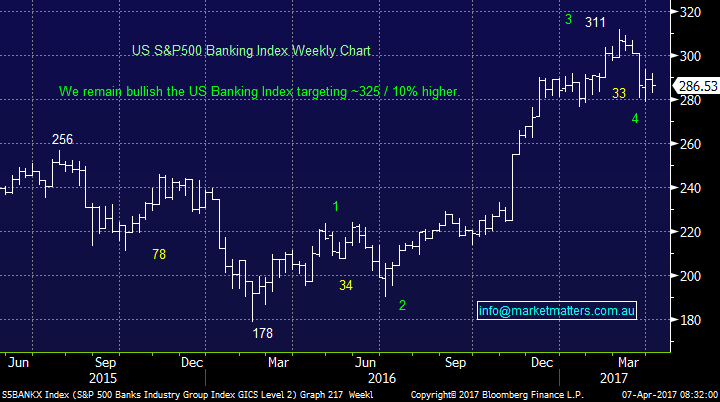
(1) The banking index corrected 34-points in mid-2016.
(2) The US banking index has now corrected 33-points over the last 5-6 weeks (10.6%).
Hence with the news in the market of why the correction has occurred we are now buyers of the US banking sector around current levels - the US banks are strongly correlated to our own "Big Four" banks. If this view proves correct it should be bullish for the ASX200 which is heavily weighted to the Financial Sector, obviously the respective regulatory boards are not helping our banking sector at the moment!
US S&P500 Banking Index Weekly Chart
2. US stocks
Back in early 2016 global equities were tumbling and the press who have continually been pessimistic about this bull market since it commenced way back in March 2009 were having a field day. At MM we stood up and bought the market aggressively literally within a few points of the low. We used a combination of factors to help us to identify when to pull the trigger which we can split into two groups as below:
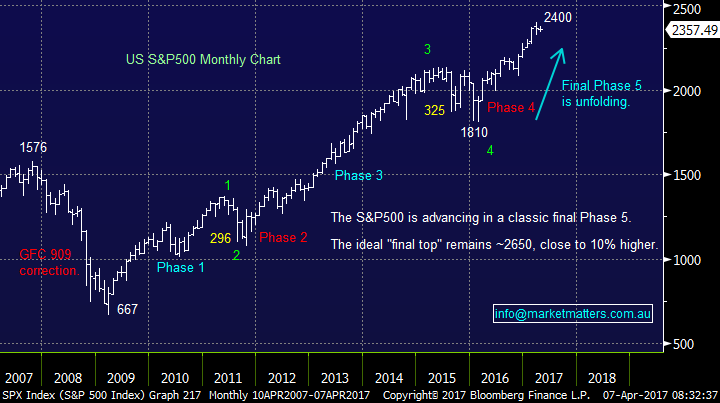
(1) A classic bull market for shares usually advances in clear a "5 Phases", we were looking to buy this Phase 4 retracement at some stage, remaining bullish in the bigger picture.
(2) A spike under the previous monthly low in the mid-1800 region of August and October 2015 made us confident that many investors would have been shaken / stopped out of the market. The ideal time to buy is clearly when everybody else has finished their selling!
So we had our buyers hat clearly on, the question was when to pull the trigger.
(1) The symmetry wave target for the S&P500 was 1836, the market finally fell to 1810, hence the correction was within 10% of the fall in 2011 i.e. Phase 2.
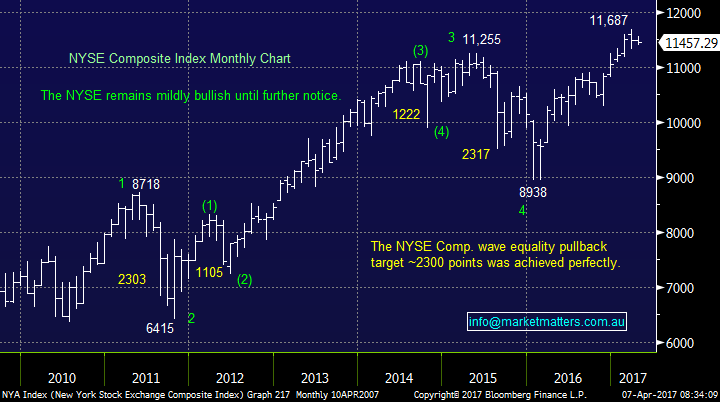
(2) However the US NYSE Composite's retracements for Phase 2 & Phase 4 were an amazingly close 2303 and 2317 points - this is an example of why we consider at a number of different indices to help complete the puzzle.
(3) We obviously looked closely at the daily picture evolving in early 2016 and it gave us an excellent buy trigger in early February - an example of why we review different timeframes for increased clarity.
This shows how we combine "Symmetry Waves" with other technical tools in an attempt to achieve optimum entry to a market - we will soon be doing the opposite for selling.
US S&P500 Monthly Chart
US NYSE Composite Monthly Chart
3. RIO Tinto (RIO)
We had been targeting a decent pullback in the resources sector after their blow-off style advance in late February - we actually went short FMG as trading a position, via options, which worked very nicely.
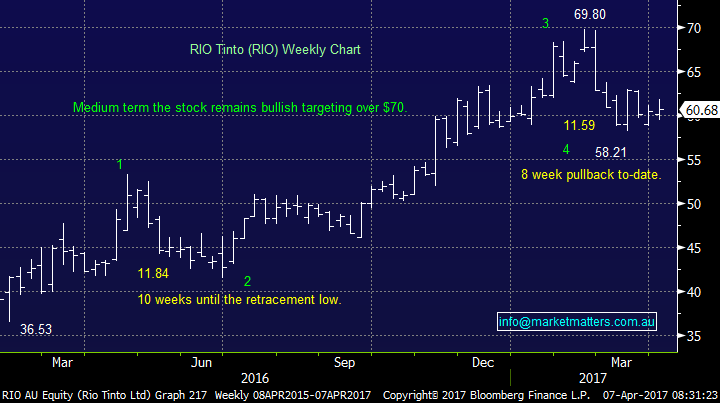
Our investment goal was to buy what we believe are the best value stocks within the sector, which in this case was the largest stocks i.e. BHP and RIO. RIO had experienced a $11.84 pullback in mid-2016 so we had our line in the sand for an ideal time to buy the diversified miner
(1) We went long under the psychological $60 area and time will tell if this proves a successful investment but we like the almost identical two retracements i.e. $11.84 and $11.59.
RIO Tinto (RIO) Weekly Chart
Wave Patterns
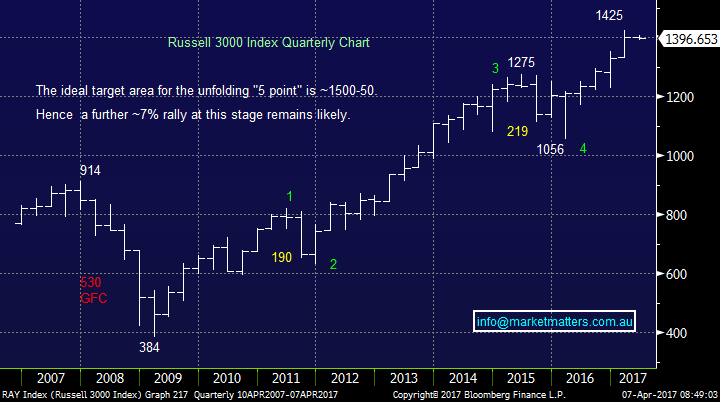
We showed earlier with the S&P500 how stock markets like to advance in a clear "5 Phases", many technical analysts roll this into an Elliott Wave count / picture. Firstly let's look at the broad based Russell 3000 Index on a long term basis:
(1) The market has advanced 371% since the bull market began back in March 2009 - a pullback is due in 2017/8.
(2) The market is in its Phase / Wave 5 which should be followed by a significant correction.
(3) The large degree pullback usually tests the "4-point" which in this case is at 1056, or 24% below this morning's close.
(4) The last major pullback was the 530-points during the GFC, hence if the next pullback is ~500-points and its going to challenge the "4-point" at 1056 the ultimate target for this current advance becomes 1550, or ~10% higher but anything ~1500 will tick the boxes for us which is 7% higher.
We are currently experiencing both the largest and longest bull market since anyone at MM has been alive, history tells us a substantial correction is on the horizon. We believe the current risk reward is up 7-10% and down 25% which is far from compelling but with the correct exit strategy we can maintain a decent exposure to stocks - for now!
US Russell 3000 Index Quarterly Chart
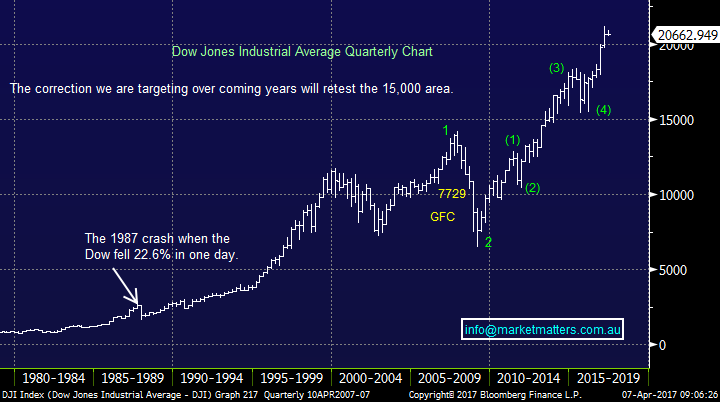
Lastly a quick look at the Dow Jones going back a few decades, it's very clear to see the amazing returns that stocks have generated since the GFC, they have been in an almost exponential rally. Our view long term is:
(1) The Dow will complete this "free money" advance since 2009, around the 23,000 area, ~8% higher in 2017/8.
(2) US stocks will then experience a correction back towards the lows of early 2016, this will be similar in size to the GFC but of course from much higher levels.
(3) importantly we do not believe this will be the end of the world as many pundits are saying just another excellent buying opportunity which we intend to be buying with a smile on our faces not panicking and selling because we've lost too much $!
Dow Jones Quarterly Chart
Conclusion
We remain short-term bullish local equities in April, unless the ASX200 breaks back under 5810 level.
However we are now wearing our medium term "sellers hat" ideally with the intention of increasing cash levels in the 5950-6000 region.
Bigger picture we have some very exciting times ahead!
Overnight Market Matters Wrap
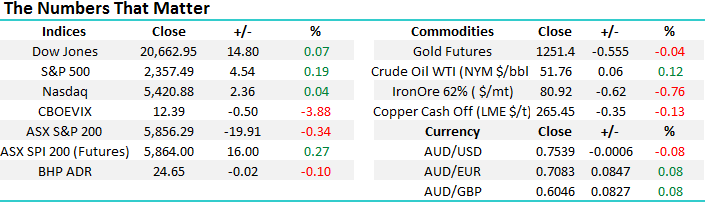
·The SPI is up 16 points as the DJIA, S&P 500 and NASDAQ all made small gains overnight.
·US President Trump and Chinese President Xi have started two days of talks in Florida.
·Investors are also waiting for US non-farm payrolls due tonight.
·Metals on the LME were lower as was iron ore. Oil rallied circa 1%.
Disclosure
Market Matters may hold stocks mentioned in this report. Subscribers can view a full list of holdings on the website by clicking here. Positions are updated each Friday.
Disclaimer
All figures contained from sources believed to be accurate. Market Matters does not make any representation of warranty as to the accuracy of the figures and disclaims any liability resulting from any inaccuracy. Prices as at 07/04/2017. 9.00AM.
Reports and other documents published on this website and email (‘Reports’) are authored by Market Matters and the reports represent the views of Market Matters. The MarketMatters Report is based on technical analysis of companies, commodities and the market in general. Technical analysis focuses on interpreting charts and other data to determine what the market sentiment about a particular financial product is, or will be. Unlike fundamental analysis, it does not involve a detailed review of the company’s financial position.
The Reports contain general, as opposed to personal, advice. That means they are prepared for multiple distributions without consideration of your investment objectives, financial situation and needs (‘Personal Circumstances’). Accordingly, any advice given is not a recommendation that a particular course of action is suitable for you and the advice is therefore not to be acted on as investment advice. You must assess whether or not any advice is appropriate for your Personal Circumstances before making any investment decisions. You can either make this assessment yourself, or if you require a personal recommendation, you can seek the assistance of a financial advisor. Market Matters or its author(s) accepts no responsibility for any losses or damages resulting from decisions made from or because of information within this publication. Investing and trading in financial products are always risky, so you should do your own research before buying or selling a financial product.
The Reports are published by Market Matters in good faith based on the facts known to it at the time of their preparation and do not purport to contain all relevant information with respect to the financial products to which they relate. Although the Reports are based on information obtained from sources believed to be reliable, Market Matters does not make any representation or warranty that they are accurate, complete or up to date and Market Matters accepts no obligation to correct or update the information or opinions in the Reports.
If you rely on a Report, you do so at your own risk. Any projections are estimates only and may not be realised in the future. Except to the extent that liability under any law cannot be excluded, Market Matters disclaims liability for all loss or damage arising as a result of any opinion, advice, recommendation, representation or information expressly or impliedly published in or in relation to this report notwithstanding any error or omission including negligence.
To unsubscribe. Click Here