Subscribers Questions
UPDATED CHART PACK – PLEASE CLICK HERE
We actually got a little positive news flow over the weekend which feels likely to help local stocks continue their march higher since Donald Trump's election victory last November. One of the pieces of news is potentially large while the other is supportive, importantly the lack of negative news will disappoint the many bears out there.
1. The US and China have agreed a "100-day trade plan" this is excellent news compared to the trade war that many feared due President Trumps aggressive rhetoric while on the election path.
2. Both Sydney and Melbourne property auction clearance rates exceeded 80%, even as the number of listings increased. If property can keep rallying in the face of so much negativity, plus increasing regulatory control, why not equities?
The local market will undoubtedly experience decreasing volumes next week as school holidays are now underway and the Easter break looms next weekend. However do not think that low volumes will equal quiet markets, its often very much the opposite. Illiquid markets often lead to exaggerated moves and this may well be the case if the ASX200 breaks over 5900. Remember the "Christmas Rally" actually starts mid-December and runs through until the new year, i.e. the quietest period in terms of volume but not price moves!
A few people we have spoken to this morning have mentioned concern over the US sending "the fleet" closer to Korea. If this has occurred following discussions with China, its potentially a positive for markets. We do not believe markets will get rattled by this today but day to day volatility is slowly returning so hence we acknowledge nothing can be taken for granted.
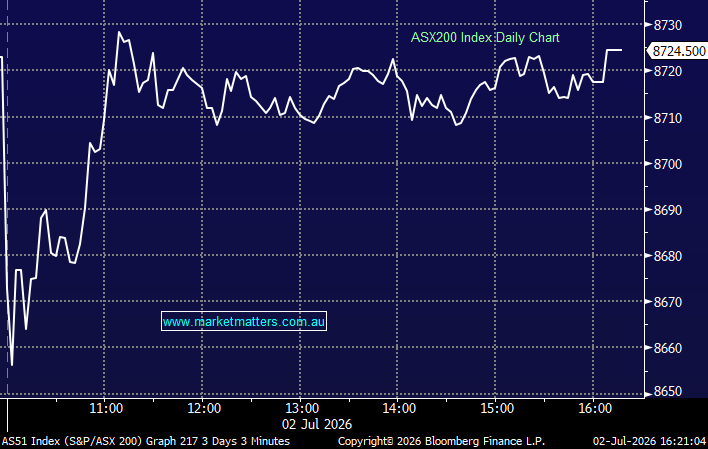
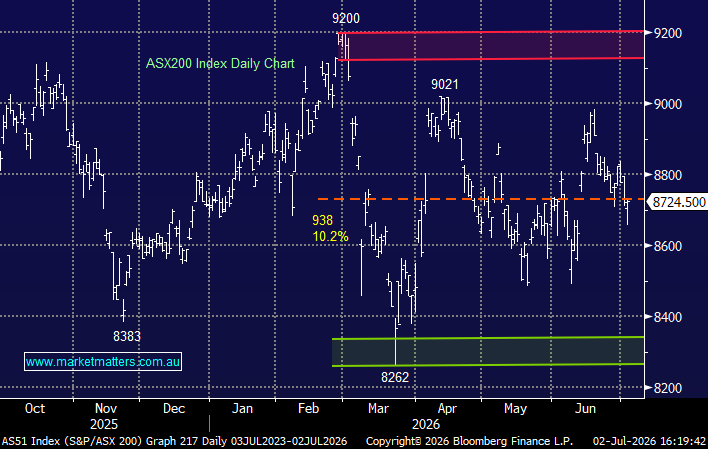
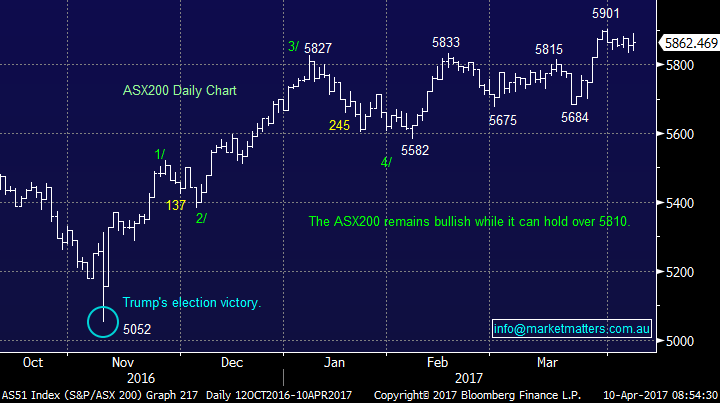
MM remains bullish short-term while the ASX200 can hold above 5810.
ASX200 Daily Chart
Question 1
"Hi Guys, Why do we regularly read that portfolios should include bonds. The returns seem to be about the same as a term deposit.!!" - Regards, John.
Morning John, a great question that many people may find interesting. Portfolio Theory consistently encourages investors to seek diversification both within the stock market and also asset classes. However we are not believers / followers of basic portfolio theory and turn to a quote from Warren Buffet to help make our point:
"Diversification is a protection against ignorance. It makes very little sense for those who know what they're doing." - Warren Buffett.
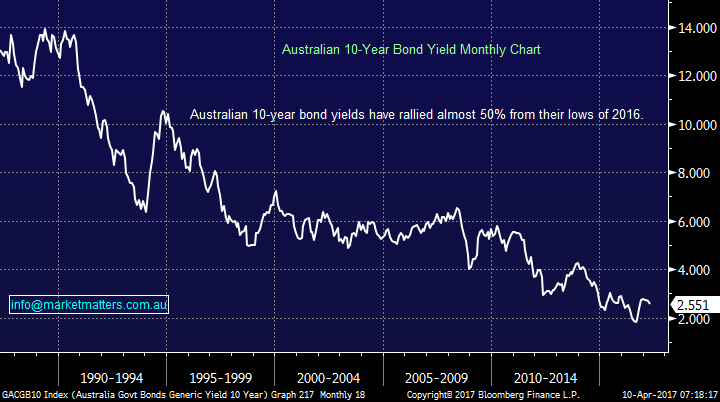
The question we ask is why invest in fixed rate Government bonds when interest rates globally are basically at the their lowest levels in history? In fact you are still receiving no yield in Germany and Japan, at least it's not negative anymore! Fund managers are generally mandated with their investments and they tweak within these parameters e.g. 50-55% stocks, 25-30% bonds, 25-30% property. The bond component is clearly regarded as the safe end of town and relied upon to cushion returns when assets enter bear markets.
We totally understand the need for many investors to limit the downside for their portfolios and many have the need for regular income, however as is the case with equities, there are ‘good investments’ and ‘poor investments’ in the bond space. It seems you are referring to Government bonds having ‘about the same’ return as a term deposit. There are some better quality corporate debt securities that give good yields, and of course hybrids, which are a mixture of debt and equity are also a good alternative, but you need to understand the complexities of them. At this juncture, we prefer either selective hybrids or buy /writes in our banks for sophisticated investors over government bonds.
NB When we believe the market is topping out we are likely to look very closely at hybrids for our portfolio.
Australian 10-year Bond yield Monthly Chart
Question 2
"Hi, General question…which bank do you see having the most potential for growth over the next week or so……" Thanks Anne.
Wow Anne, over the next 2 weeks is very short term, moves over a few days /weeks include a lot of noise. Growth is usually a word we associate with years and gains with weeks. Our best answer to your question would be as follows:
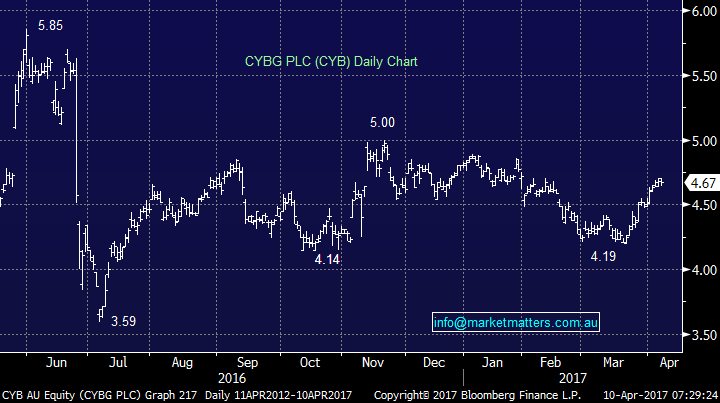
1. Our preferred bank for the rest of 2017 is Europe facing CYB, which we are considering strongly buying.
2. Over coming weeks we would go with one of the 3 "big 4" banks going ex-dividend in May - ANZ, NAB or WBC. They are very similar but our slight favourite just here is NAB.
3. A touch more aggressive at present but technically Bank of Queensland looks very good right here and it pays a 38c fully franked dividend in late April.
Hopefully this helped with your tricky question!
CYBG Plc Daily Chart
Question 3
"Hi, I would appreciate further explanation on DOT theory in Mondays report thank you." - Best Regards, Alex.
Morning Alex, great question, were always happy to expand on our ideas to ensure subscribers fully understand our theories and views.
"The DOT Theory : A market makes the high, or low, of any timeframe in the first 20% of a particular timeframe".
This is a theory that we regularly consider when combining with our overall view of the market and in particular statistical ranges. Let's go through last month's ASX200 as a great example:
1. We know the ASX200 is currently moving around 110-points every week and 225-points every month - simple mean averages, note this is only particularly useful if the standard deviation is relatively low.
2. Last month we were overall bullish local stocks for a number of reasons, both technical and fundamental.
3. In March the ASX200 had only traded between 5675 and 5815 (140-points) with 4 days of the month remaining.
Hence if the market broke above 5815 we were 80% confident 5675 was the low for March, hence extrapolating the average monthly range of 225-points onto this targeted 5900 in March alone - within 4-days! Hence we stated our belief that a break of 5815 would hit 5900 very quickly which in this case unfolded perfectly. The DOT Theory is simple and can be very useful, a few thoughts:
1. To use the DOT Theory investors need to do their work to understand the characteristic of the particular market they are looking at, alas most people are too busy!
2. It only works ~80% of the time so as usual investors / traders must remain flexible and open-minded.
3. Let's consider the ASX200 on a yearly basis we are now well through the first 20% of 2017 and the market has oscillated between 5582 and 5901 i.e. 319-points. The lowest annual range of the last decade is 627-points. Hence if 5582 holds this year
we should eventually reach at least the 6200 area, which is the MM view.
Question 4
"you had to be quick..."Ummm..... That sounds like rubbing salt in the wound after yesterday's failure to notify on a prompt basis" - Rob. (in reference to our trade alert in Oz Minerals (OZL) last week)
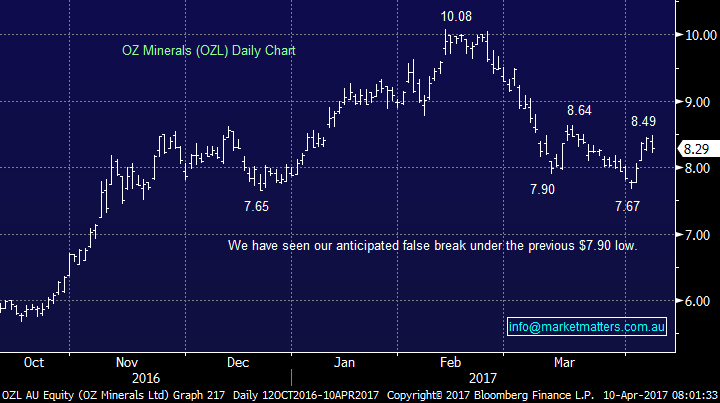
Morning Rob, a tough email but we won't ignore it. Unfortunately markets can be very fast at times and we miss many opportunities, a great example was Cochlear back in February under $125. We had stated our intention to buy the stock under this level in previous reports but it spent well under 10-minutes in our buy zone making purchases (and communicating with our subscribers) impossible. However unlike many similar businesses we never claim to have purchased something just because it hit our buy level. We understand this can be frustrating at times, especially as we all live busy lives. In regards to OZL we make the following observations in our "defence":
1. We had been discussing buying OZL under $7.90 in detail for a few days in the reports
2. The OZL email alert was received by the bulk of subscribers ~15-minutes before the market opened giving investors time to act. Please note, some email services are slower than others – this is obviously out of our control.
3. We never purchase / sell stocks until subscribers have received alerts, so there is time to act but clearly acknowledge at times it may be limited, especially in today's busy world.
As we have stated before, we are working on this to improve the service with the goal of both email / mobile alerts being delivered more efficiently.
OZ Minerals (OZL) Daily Chart
Question 5
"when you state that you will be selling into strength to increase your cash position, can you make a comment for those of us who have a cash position prepared, as to whether we should be selling. eg I have recently bought a parcel of RHC but would be disappointed to make the " small gain" you mentioned as I see them much like a CSL which I have held a long time. I guess my request is just to say whether, if you didn't need to raise the cash position you would still be selling. That would give others the option to sell say only a portion of the holding if you had long term conviction for the share to be one worthy of holding." - Deborah.
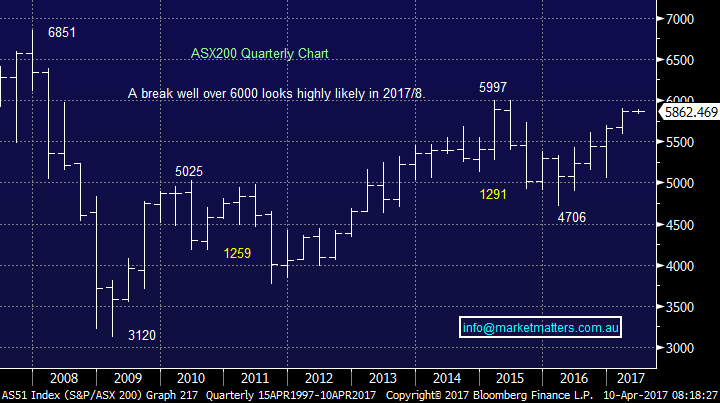
Morning Deborah, a great question and we really appreciate it - thanks! The simple answer is no, we are looking to increase our cash position back over 20% as we anticipate a pullback in May-June which we intend to step up and buy. We are aiming to add ~10% to this portion of our portfolio that we will switch / tweak, it's not a major sell.
In summary:
1. We don’t comment on individual circumstances however if we were holding higher cash levels we may not be selling but looking for a pullback in May-June to commence buying.
2. In the bigger picture we are targeting 6200-6300 in 2017 hence we will not be holding high cash positions for too long.
ASX200 Quarterly Chart
Question 6
"Hi there MM team, A quick FYI and a question.
FYI - the link to the chart pack and positions/portfolio are both from last week."
Apologies Chris, we have a few members of the team away on Easter break. The Chart Pack has been updated this morning and the updated portfolio will be sent out shortly.
Question 7
"I picked up Vocus after it's first leg down last year, and having averaged it a few times am sitting at ~ 15% down. Because of the averaging, it is however, the largest holding in my portfolio at around 12% - hence a little uncomfortable. I notice you intend to liquidate your position next week. Having fallen so far over the last 12 months, surely a bottom must form soon / the market may be unfairly punishing the business to some degree? Or is there some significant business risk I'm not aware of (beyond the Singapore development)? My distinct preference is to hold on to this one and wait for a sharp bounce next reporting season. Reasonable assumption? Crazy?" - Thanks, Chris.
Like you Chris we are both down and holding too much VOC. A couple of quick insights as to our rationale:
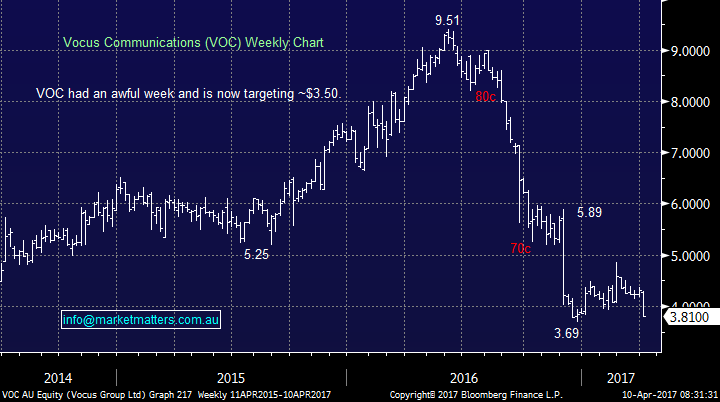
1. After last week’s fall we would no longer buy the stock today so why hold it? Technically the stock is showing weakness and we now have a technical target of ~$3.50
2. Fundamentally, the stock is clearly cheap and the company has good assets, however it’s now cheap for a reason. There is a higher degree of earnings risk in the forward years resulting from last week’s announcement by Superloop that they are building a new subsea cable between Australia and South East Asia, directly competing with VOC’s Australia Singapore Cable (ASC). Superloop have locked in Telstra, Singtel, Google, plus some others as customers which is clearly a negative for VOC. This compounds existing uncertainty created by the NBN, around pricing, churn, margin compression etc – simply too much negativity / concerns for us on the short term.
3. This has been the one stock that unfortunately proves we are human over recent years and it is taking up way too much thought and emotion.
4. We believe VOC has a strong possibility of a good bounce from ~$3.50 but buying here will be an aggressive trade to us not an investment.
5. If our holding was small we would be considering averaging ~$3.50, an action we may be forced to consider if the stock gaps lower this morning.
Overall like yourself we will be glad to see the back of VOC, a prime example in hindsight to not ignore when directors sell shares in their own company, and importantly technical indicators / flags should not be ignored
Vocus Group (VOC) Weekly Chart
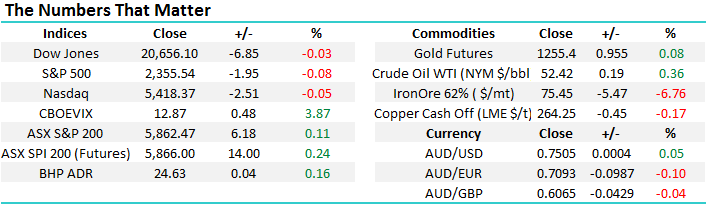
Overnight Market Matters Wrap
· The US major share indices closed marginally lower, with US earnings season kicking off tonight.
· US employers only added 98,000 jobs in March against expectations of 180,000. Bad weather was blamed for a hit to construction hiring.
· Oil, aluminium, nickel and gold traded higher, while copper was weaker on the LME.
· Iron ore fell into bear territory as it fell 6.8% to $US75.45/t.
· The June SPI Futures is indicating the ASX 200 to open 23 points higher this morning, towards the 5,885 level.
Disclosure
Market Matters may hold stocks mentioned in this report. Subscribers can view a full list of holdings on the website by clicking here. Positions are updated each Friday.
Disclaimer
All figures contained from sources believed to be accurate. Market Matters does not make any representation of warranty as to the accuracy of the figures and disclaims any liability resulting from any inaccuracy. Prices as at 10/04/2017. 9.21AM.
Reports and other documents published on this website and email (‘Reports’) are authored by Market Matters and the reports represent the views of Market Matters. The MarketMatters Report is based on technical analysis of companies, commodities and the market in general. Technical analysis focuses on interpreting charts and other data to determine what the market sentiment about a particular financial product is, or will be. Unlike fundamental analysis, it does not involve a detailed review of the company’s financial position.
The Reports contain general, as opposed to personal, advice. That means they are prepared for multiple distributions without consideration of your investment objectives, financial situation and needs (‘Personal Circumstances’). Accordingly, any advice given is not a recommendation that a particular course of action is suitable for you and the advice is therefore not to be acted on as investment advice. You must assess whether or not any advice is appropriate for your Personal Circumstances before making any investment decisions. You can either make this assessment yourself, or if you require a personal recommendation, you can seek the assistance of a financial advisor. Market Matters or its author(s) accepts no responsibility for any losses or damages resulting from decisions made from or because of information within this publication. Investing and trading in financial products are always risky, so you should do your own research before buying or selling a financial product.
The Reports are published by Market Matters in good faith based on the facts known to it at the time of their preparation and do not purport to contain all relevant information with respect to the financial products to which they relate. Although the Reports are based on information obtained from sources believed to be reliable, Market Matters does not make any representation or warranty that they are accurate, complete or up to date and Market Matters accepts no obligation to correct or update the information or opinions in the Reports.
If you rely on a Report, you do so at your own risk. Any projections are estimates only and may not be realised in the future. Except to the extent that liability under any law cannot be excluded, Market Matters disclaims liability for all loss or damage arising as a result of any opinion, advice, recommendation, representation or information expressly or impliedly published in or in relation to this report notwithstanding any error or omission including negligence.
To unsubscribe. Click Here