Are we still comfortable with our positive stance on resources?
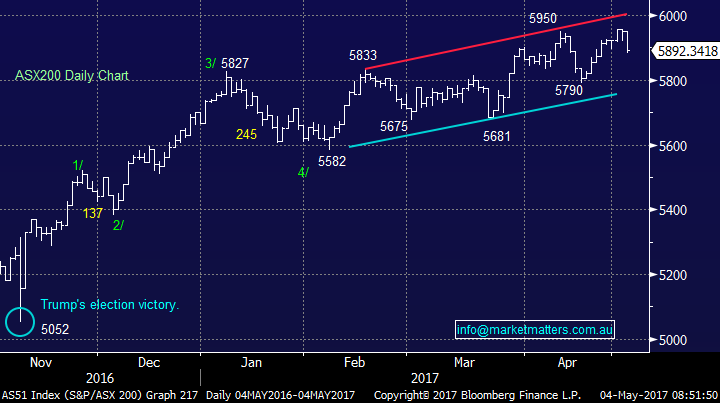
Yesterday we saw selling intensify with the ASX 200 down by ~1% with the financial and material stocks the two worse performing sectors. We continue to believe there is a far greater than 50% chance that we have commenced an inflection week for the ASX 200 with the seasonal weakness that is typical in May starting to play out.
ASX 200 Daily Chart
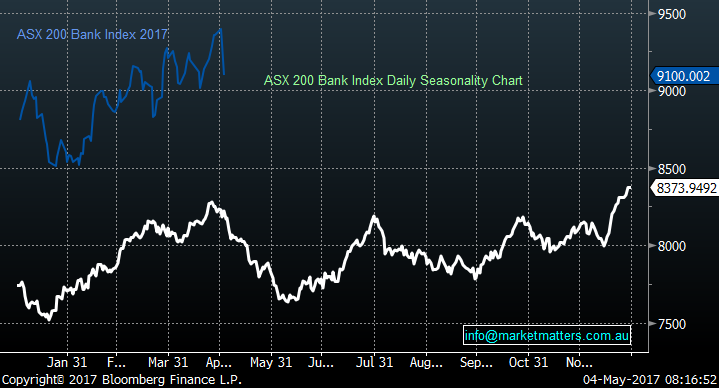
The banks are the main driver of the index with ANZ, CBA, NAB & WBC accounting for 27.07% of the ASX 200 making them the most critical influence on the direction of the market. 3 of the big 4 banks go ex-dividend this month after reporting results however history shows that they often fall more than their dividend amount. The average return for the sector over the month is a decline of around ~1.5% , which is clearly negative however in our view, that average performance will prove to be a little ‘light on’ for May of 2017 given the strong lead up / buying the sector has experienced. Resource stocks are generally ‘OK’ in May and we maintain a positive stance towards the sector for now, while the Insurers are our biggest ‘bullish bet’ in the portfolio. Clearly, markets are getting exciting and this morning we’ll look at the three main sectors we have exposure to; Banks, Materials & Insurance.
1. Banks – We trimmed our exposure by selling CBA last Friday, however continue to hold ANZ and NAB for the looming dividends. May is a weak period for banks and better entry into the sector is likely over the next 6 weeks.
Banking index – seasonality chart
ANZ reported on Tuesday and the result was met with some mixed emotions. On the negative side, earnings were a tad soft, margins a little weak and more write downs came from Mike Smith’s failed foray into Asia, however, and this is important, their capital position was a lot stronger than the market was expecting with tier 1 capital at 10.1%. Whether or not that level will prove to be ‘unquestionably strong’ in the eyes of the regulator will be determined in the next few months, however ANZ is now ‘capital heavy’ with more to come as they continue to sell capital intensive Asian businesses. The market may well start to focus on the prospect of capital returns to shareholders once the regulator clarifies their view in the next few months. Because of its strong capital position and looming dividend, we remain comfortable holders of ANZ however as mentioned yesterday, shorter term traders could look to sell ANZ and switch into SUN.
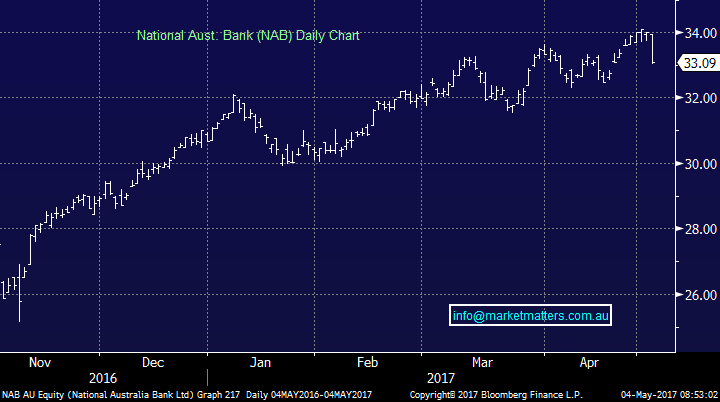
We also hold a smaller position in NAB which reported this morning, and the numbers look reasonable. Stripping out all the noise, cash earnings have come in around +1% above consensus while earnings per share are about a 2% beat however the net interest margin was again a tad soft, at 1.82% v expectations of 1.84%. NAB also reported a very strong capital position similar to ANZ on Tuesday. Leading into this result, there was some concern around the dividend however NAB have maintained 99cps for the half. They go ex-dividend on the 16th May.
NAB Daily Chart
As it stands, we have a 12% allocation in two of the majors and we’re comfortable with that level of exposure, looking to increase back towards 20% into weakness.
2. Materials – We recently increased our exposure by adding Oz Minerals, and increasing our holding in BHP. We also hold RIO,
Materials – seasonality chart
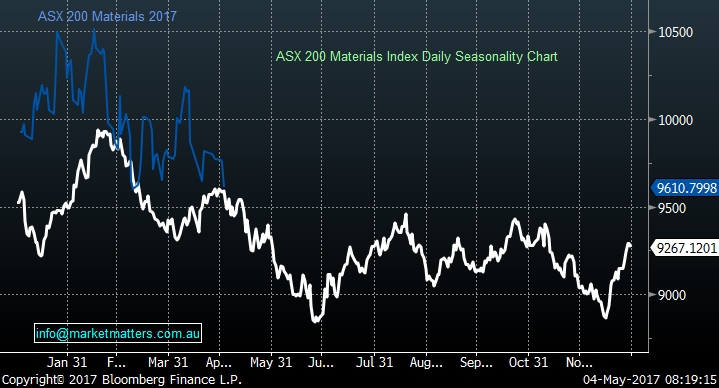
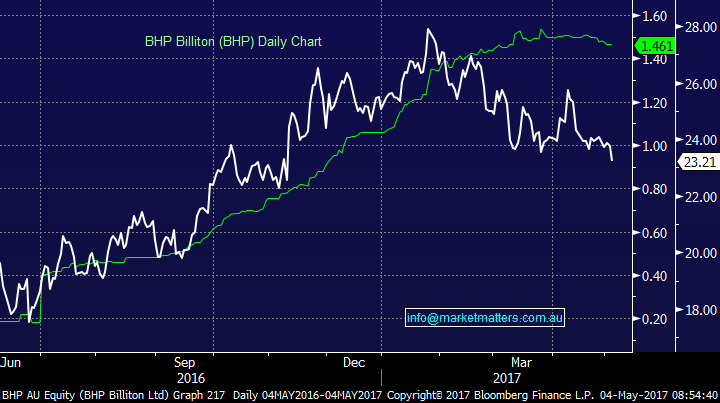
Given yesterday’s price action and in particular, the weakness in BHP which is likely to be extended this morning, we ask ourselves the obvious question of whether or not we remain comfortable in the sector? For now we are however believe it’s an area to be very selective within. From a seasonal perspective, the start of May is often weak as the miners get caught up in the ‘general market weakness’ however by the end of May buying usually comes back in, and the overall performance is generally slightly positive. Iron Ore is obviously a big influence and now looks likely to trade in a range between $60 / $80 for the foreseeable future and we remain overall neutral Iron Ore. If that range plays out, the mid-point is $70 which is around about where consensus sits for the Iron Ore price. Iron Ore is obviously volatile however if it ticks around this level the earnings expectations for the miners will hold firm and the gap between earnings and the share price will close. If BHP delivers the earnings that the market expects it to, then it should trade closer to $28.
BHP Earnings v BHP Share Price
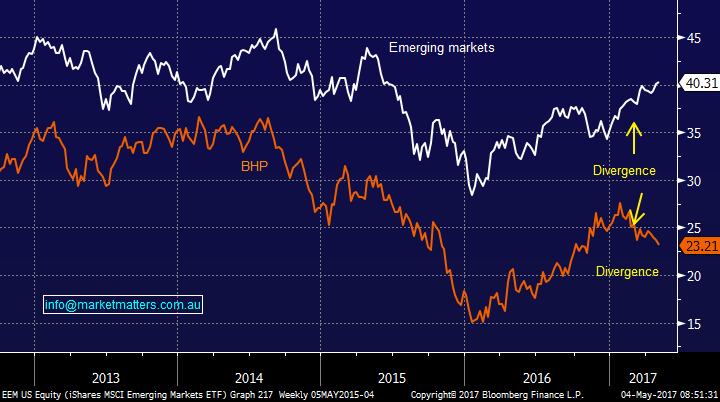
We’ve also included the below chart recently which tracks BHP share price versus the emerging markets. For the first time in years we are seeing some clear divergence between BHP and the Emerging Markets Index, we believe this will come back into line in the coming months with BHP rallying.
BHP v Emerging Markets
As it stands, we have a 17.5% allocation to three mining stocks and are comfortable with that level for now
3. Insurance – We have QBE and SUN in the portfolio and this is our biggest ‘overweight call’.
Insurance Seasonal Chart
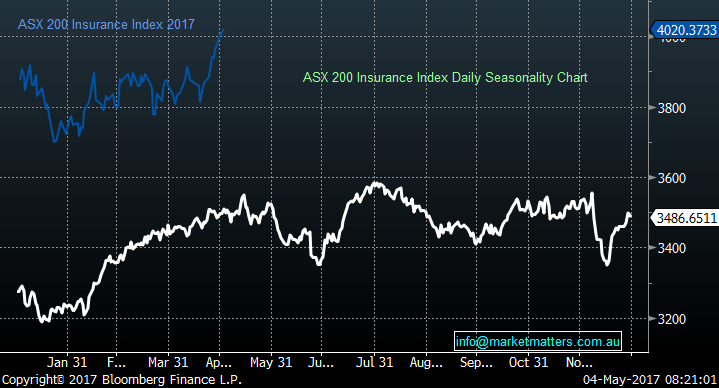
We’ve written a lot about insurance stocks in recent times, so apologies for the repetition however it does make up a large part of the MM portfolio with a 16% allocation through SUN and QBE. To put this ‘bullish call’ into context, these two stocks account for 2.11% of the ASX 200. QBE had their AGM yesterday and we heard from the Chairman and CEO. In terms of bigger picture themes they talked about conditions still being tough (as they always do), but improving both in terms of insurance pricing (particularly strong in Australia) and the investment returns from their portfolio. They reconfirmed their targets for 2017/18 and importantly, they talked less about the ‘turnaround’ strategy and more about optimising the business. Insurance is a difficult space, with many factors that can dictate earnings. For the first time in many years it seems insurers may have the double benefit of rising investment returns and rising premiums which is very bullish for earnings. At the same time, QBE is coming out the other side of a major transformation process that sees them in a very good position to take advantage of these improving conditions.
QBE Insurance (QBE) Weekly Chart
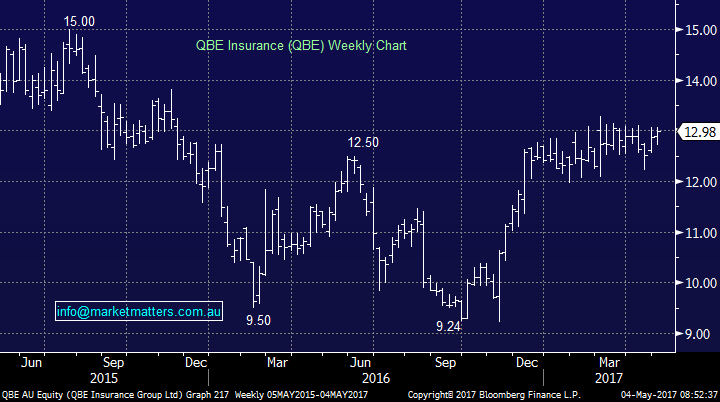
As it stands, we have a 16% allocation to two insurance stocks and we are comfortable with that ‘heavy’ stance.
Conclusion (s)
The main conclusions for today:
1. We remain bullish the resources sector despite the short term weakness
2. We are now underweight banks into May looking to increase exposure again into weakness
3. Insurance stocks are performing very well and we like our big position in this sector
Overnight Market Matters Wrap
·Another mildly mixed close in the US overnight, as investors digest the Federal Reserve comments following the FOMC meeting and conclusion of no rate change this month.
·The US Fed Reserve believes that the current weak economic data is temporary and maintains their current plan with more rate hikes currently anticipated this year.
·Domestically, we expect to follow the US lead with the financials and energy sector to outperform the broader market. Santos (STO) will be widely looked at, after China’s, Hony Capital increased their holding by ~2.3% to own above 15% of STO.
·The June SPI Futures is indicating the ASX 200 to open 5 points higher, testing the 5900 resistance level this morning.
Disclosure
Market Matters may hold stocks mentioned in this report. Subscribers can view a full list of holdings on the website by clicking here. Positions are updated each Friday.
Disclaimer
All figures contained from sources believed to be accurate. Market Matters does not make any representation of warranty as to the accuracy of the figures and disclaims any liability resulting from any inaccuracy. Prices as at 04/05/2017. 9.00AM.
Reports and other documents published on this website and email (‘Reports’) are authored by Market Matters and the reports represent the views of Market Matters. The MarketMatters Report is based on technical analysis of companies, commodities and the market in general. Technical analysis focuses on interpreting charts and other data to determine what the market sentiment about a particular financial product is, or will be. Unlike fundamental analysis, it does not involve a detailed review of the company’s financial position.
The Reports contain general, as opposed to personal, advice. That means they are prepared for multiple distributions without consideration of your investment objectives, financial situation and needs (‘Personal Circumstances’). Accordingly, any advice given is not a recommendation that a particular course of action is suitable for you and the advice is therefore not to be acted on as investment advice. You must assess whether or not any advice is appropriate for your Personal Circumstances before making any investment decisions. You can either make this assessment yourself, or if you require a personal recommendation, you can seek the assistance of a financial advisor. Market Matters or its author(s) accepts no responsibility for any losses or damages resulting from decisions made from or because of information within this publication. Investing and trading in financial products are always risky, so you should do your own research before buying or selling a financial product.
The Reports are published by Market Matters in good faith based on the facts known to it at the time of their preparation and do not purport to contain all relevant information with respect to the financial products to which they relate. Although the Reports are based on information obtained from sources believed to be reliable, Market Matters does not make any representation or warranty that they are accurate, complete or up to date and Market Matters accepts no obligation to correct or update the information or opinions in the Reports.
If you rely on a Report, you do so at your own risk. Any projections are estimates only and may not be realised in the future. Except to the extent that liability under any law cannot be excluded, Market Matters disclaims liability for all loss or damage arising as a result of any opinion, advice, recommendation, representation or information expressly or impliedly published in or in relation to this report notwithstanding any error or omission including negligence.
To unsubscribe. Click Here