Subscriber’s questions
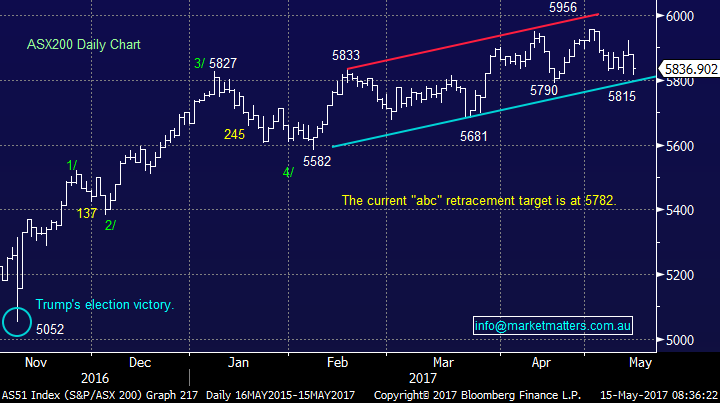
Last week was extremely interesting for local stocks, primarily courtesy of Tuesday’s Australian Federal budget handed down by the Liberal Party’s, Scott Morrison. From a market perspective, the $6.2bn slug to the big 5 banks (including Macquarie) was the stand out, which unsurprisingly led to a decent correction for the sector e.g. CBA was down almost $6 (7%) at one stage, just for the week. On balance we remain negative the ASX200 during this seasonally weak May-June time period, anticipating a probable test of the 5700 area, and potentially even 5600.
ASX200 Daily Chart
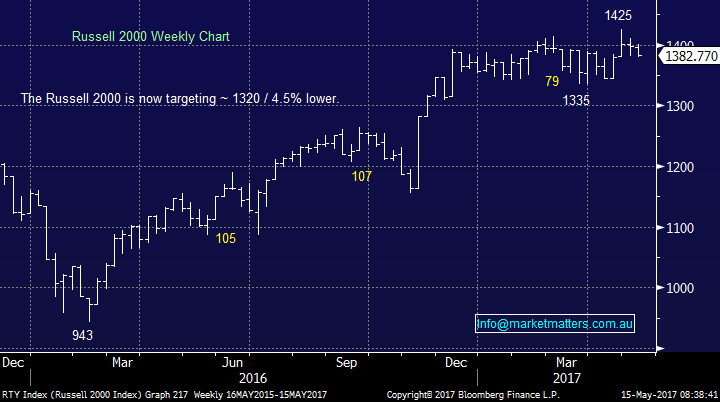
What has been interesting of late is the exceptional calm within stock markets, last week the “Fear Index” (VIX) tested 24-year lows. Pretty amazing stuff when we consider the news flow around just Donald Trump and North Korea to raise two simple topical examples. We believe that US stocks are positioned perfectly for a 4-5% correction, they just need a small catalyst and the May factor in investors’ minds will probably do the rest, making a pullback self-fulfilling!
Potentially we are approaching a “the straw that broke the camel’s back” situation, with North Korea conducting another round of missile testing. We have no doubt that Donald Trump hates the lack of respect he’s being offered by the young dictator and markets have always hated uncertainty.
Russell 2000 Weekly Chart
Question 1
“Hi Guys, Is SIRTEX (SRX) a buy at its current price?” – Cheers Lyle.
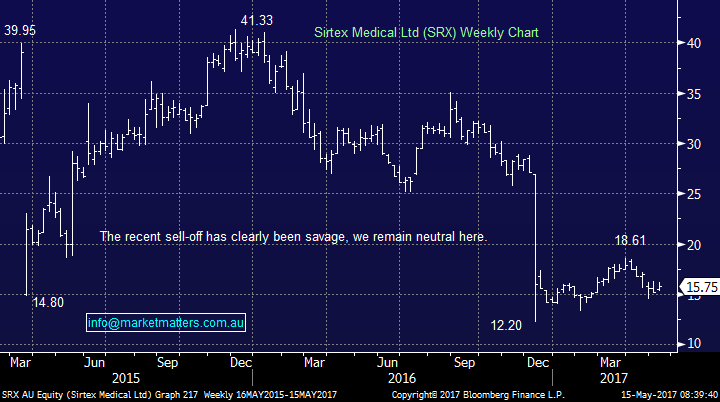
Morning Lyle, a great question because we have started paying more attention to SRX over recent weeks following its 15% correction from March 2017 highs.
In late April, trial results were released comparing two treatments for late stage liver cancer. The treatments were SIRT, pioneered by Australian biotech, Sirtex, versus Sorafenib. The market was clearly hoping for more from SRX and has limited tolerance with the Australian bio-tech following its 60% decline since the 2016 ~$41 highs, hence further weakness prevailed which is highlighted by the following chart.
Considering our current view on stocks and the markets “glass half empty” opinion towards SRX we believe buying should only be implemented into further weakness. The stocks volatility is obviously huge and we are happy not to get set unless excellent risk / reward opportunities present themselves.
Our ideal buy area for SRX is between $10 and $11, still significantly lower and would need a major catalyst to get there.
Sirtex (SRX) Weekly Chart
Question 2
“Good morning Market Matters Team, I would like to ask a question around Henderson Group (HGG) which Market Matters been bullish on for some for it's medium to longer term prospects especially post the merger with Janus Funds Management. To my best knowledge, the actual de-listing in UK will occur simultaneously with re-listing in NY on 30th of May 2017. A large investment bank / broker offered to the broader investment market late last week a report on HGG, indicating there's significant growth prospects post the merger process is completed and suggesting this is a great way for domestic retail investors (like myself) to gain exposure in both US and UK financial markets. Would the Market Matters team agree with this reasoning and what price target is the team aiming for as a medium term investment ?” – Tianlei.
Morning Tianlei, as you say we have been long HGG since the start of the year and our position is currently showing a healthy 9.5% + dividends profit.
MM bought HGG for 3 simple reasons:
1. We are bullish the financial sector.
2. We particularly like Europe at this stage in the cycle, just where HGG has a huge footprint.
3. HGG was very cheap compared to its market piers.
Over the last month HGG has rallied over 10% while the sector has only advanced 4.8% reducing the attractiveness of point 3. However we still believe in both points 1 and 2.
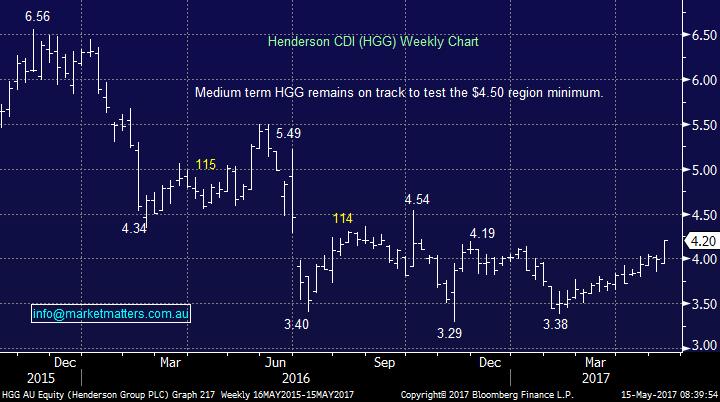
Hence we will continue to hold HGG with our ideal target of $4.40-50 slowly but surely approaching.
Conversely the current trend of listed fund managers (PTM and KAM) reducing their fees does concern us and we would not be “chasing” the stock at current levels. Considering we only see a further 6-8% upside to global equities medium-term we would consider ETF’s for Europe / US exposure if that was our main motivation behind an investment.
Henderson Group (HGG) Weekly Chart
Question 3
"Hi, We often hear the target prices of stocks quoted by analysts, my question is what is the time frame for these targets? Is that what they think the price should be now, by the end of the year or what?” – Thanks Richard.
Great question Richard! In terms of published analyst target price for stocks it is what analysts are think the stock should be worth in 12 months’ time taking into account their current list of assumptions around the company and projections / forecasts for external factors like commodity prices, interest rates and so forth.
The reason that analysts often race to upgrade / downgrade their price target for a stock is because these very assumptions are changed either by company specific news and / or underlying trading conditions that will affect the company’s profitability / growth outlook into the future.
Looking at BHP for instance and using Macquarie’s Hayden Bairstow as an example, the yellow line has been his historical 12 month price target for the miner. The interesting aspect to note is that the price target was above the prevailing price in the decline, but as BHP based out in terms of share price, his price target was more bearish than the price suggesting he thought that the miner would continue to fall in price. Only when the price of BHP started rallying strongly, did the price target take a big jump higher! We’re cynics at MM, however we do play close attention to what analysts are doing, but certainly do not follow them blindly!
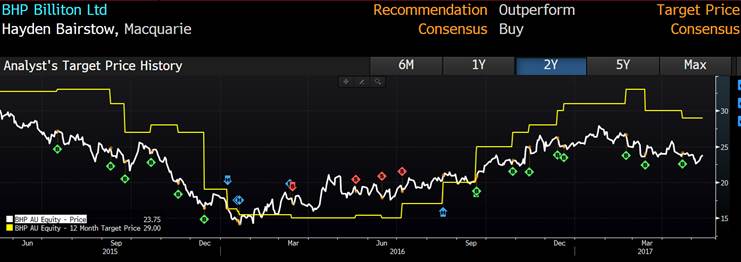
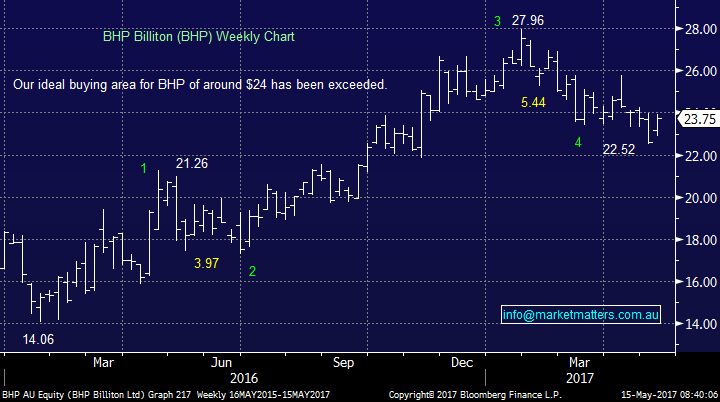
In terms of the MM price targets, ours also have a technical influence rather than being solely fundamentally generated. We believe that there are simply too many variables / inputs / things that can go wrong in terms of earnings for us to solely base our price targets on this. BHP for instance, we think a break of $24 will see $25.50-26 relatively quickly. As it stands, the 12 month consensus price target on BHP is $27.33 which is the average of all analysts that cover BHP and submit their forecast to Bloomberg
BHP Billiton (BHP) Weekly Chart
Question 4
“Good evening, Just wanting your thoughts on Telstra. Do you think due to the large drop recently that investors will see good value in the stock and that it may be less affected by any pull back this month? There looks to be around 20% more buyers than sellers at the moment. Is this a good sign it should continue to pull back recent losses?” – Leighton
Morning Leighton, TLS is certainly been a topical stock over recent weeks and we have a 5% exposure from the current area. Your question has a few parts so we will address in point form:
1. The larger number of buyers compared to sellers may easily be a negative sign. If lots of retail investors are buying, to chase yield, from generally more informed fund managers I would be wary.
2. We believe the stock is likely to range trade over the next 1-2 years as the changing landscape and increased mobile competition impact profitability / and importantly, the markets view around future profitability
3. Hence we believe there will be opportunities in the stock to acquire some healthy fully franked dividends but only with selective buying.
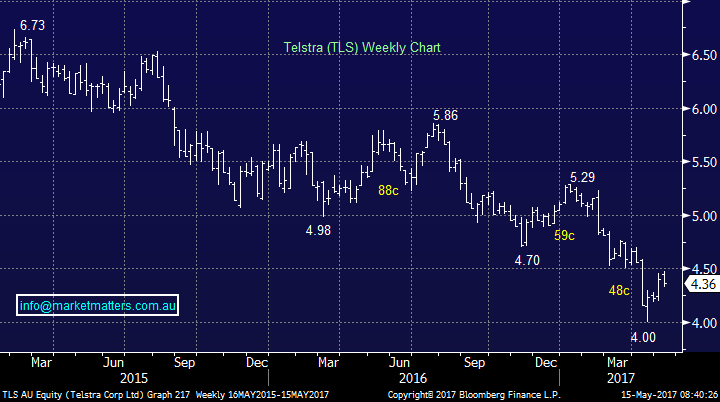
Currently we are buyers around $3.90 and sellers ~$4.55.
Telstra (TLS) Weekly Chart
Overnight Market Matters Wrap
· A marginally positive close on Friday for US stocks, with only the ‘tech’ index finishing in positive territory.
· The retailers, domestically and abroad were of concern, with the consumer discretionary sector underperforming the broader S&P 500 the most.
· The June SPI Futures is indicating the ASX 200 to open with little change this morning from the previous close of 5836.
Disclosure
Market Matters may hold stocks mentioned in this report. Subscribers can view a full list of holdings on the website by clicking here. Positions are updated each Friday.
Disclaimer
All figures contained from sources believed to be accurate. Market Matters does not make any representation of warranty as to the accuracy of the figures and disclaims any liability resulting from any inaccuracy. Prices as at 15/05/2017. 8.00AM.
Reports and other documents published on this website and email (‘Reports’) are authored by Market Matters and the reports represent the views of Market Matters. The MarketMatters Report is based on technical analysis of companies, commodities and the market in general. Technical analysis focuses on interpreting charts and other data to determine what the market sentiment about a particular financial product is, or will be. Unlike fundamental analysis, it does not involve a detailed review of the company’s financial position.
The Reports contain general, as opposed to personal, advice. That means they are prepared for multiple distributions without consideration of your investment objectives, financial situation and needs (‘Personal Circumstances’). Accordingly, any advice given is not a recommendation that a particular course of action is suitable for you and the advice is therefore not to be acted on as investment advice. You must assess whether or not any advice is appropriate for your Personal Circumstances before making any investment decisions. You can either make this assessment yourself, or if you require a personal recommendation, you can seek the assistance of a financial advisor. Market Matters or its author(s) accepts no responsibility for any losses or damages resulting from decisions made from or because of information within this publication. Investing and trading in financial products are always risky, so you should do your own research before buying or selling a financial product.
The Reports are published by Market Matters in good faith based on the facts known to it at the time of their preparation and do not purport to contain all relevant information with respect to the financial products to which they relate. Although the Reports are based on information obtained from sources believed to be reliable, Market Matters does not make any representation or warranty that they are accurate, complete or up to date and Market Matters accepts no obligation to correct or update the information or opinions in the Reports.
If you rely on a Report, you do so at your own risk. Any projections are estimates only and may not be realised in the future. Except to the extent that liability under any law cannot be excluded, Market Matters disclaims liability for all loss or damage arising as a result of any opinion, advice, recommendation, representation or information expressly or impliedly published in or in relation to this report notwithstanding any error or omission including negligence.
To unsubscribe. Click Here