Investors feel comfortable on the sidelines as tragedy strikes
Australian equities drifted lower all day as the heartbreaking news from Manchester dominated both the thoughts and conversation of most market players. Our thoughts and prayers are with all the friends and families affected by the horrendous attack at Manchester Arena.
It’s very hard to write an insightful and enthusiastic report when the bulk of the press this morning is so sobering, hence today we’ve totally changed direction and focused on the US “FANG” stocks which have been leading the global bull market over recent years i.e. Facebook, Amazon, Netflix and Google – until they start failing it’s unlikely others will follow.
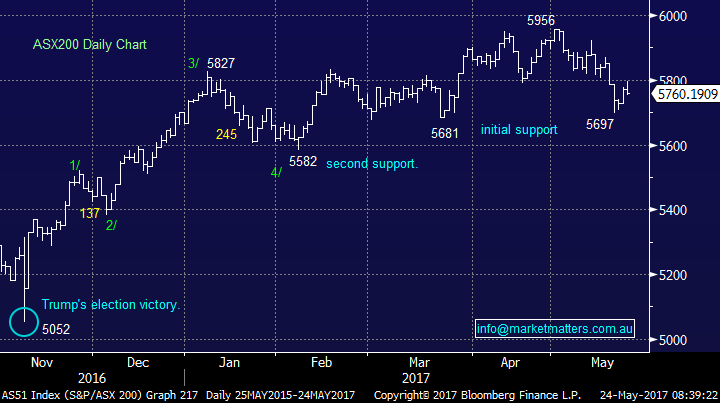
On an index level we continue to believe the local market is suffering its “sell in May and go away” correction with a close over 5830 required by the ASX200 to switch us back to a neutral stance i.e. 1.2% higher.
Again we quote the two simple statistics we are watching to put May’s recent weakness into perspective:
1. The average decline for the ASX200 over May / June since the GFC is 6.9%, yesterdays close is 3.3% below the May 1sthigh implying only half of our correction has unfolded. It’s easy to comprehend further declines as US stocks remain around their all-time high.
2. The average pullback for CBA during May / June since the GFC is over 10% which targets the $79 area – so far CBA has hit $79.53.
We reiterate, at this stage we still believe any weakness over this May-June period is an opportunity to buy, not panic sell.
ASX200 Daily Chart
US markets rallied again last night with the S&P500 closing up 0.2% testing its all-time high. We remain short-term cautious / bearish but very aware of the strength of this underlying bull market, the path of least resistance clearly remains up.
We continue to remain buyers of weakness while not believing a break to fresh highs will follow through with any meaningful momentum. Technically we regard the NASDAQ on a weekly basis as one of the clearest charts at present with our ideal buy level back towards the 5400 area – the level we were at in late April, ~4.5% lower.
US NASDAQ Weekly Chart
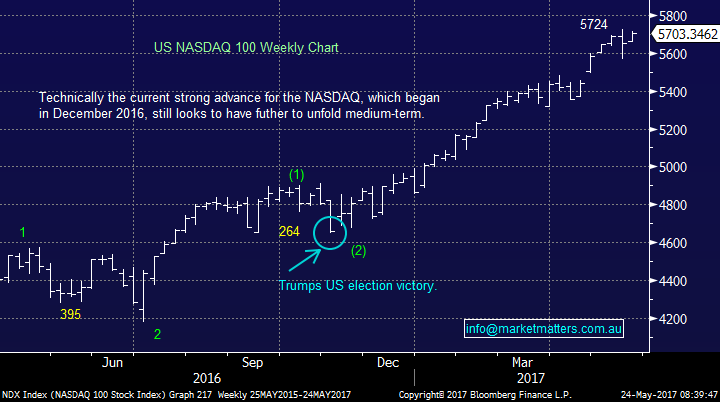
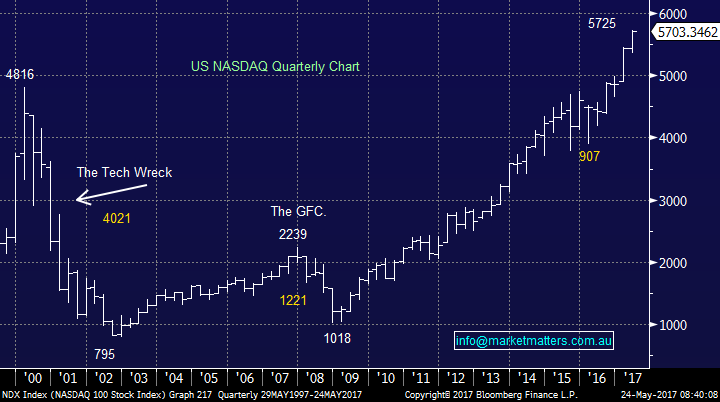
The US NASDAQ is the index we regularly say leads global equities and while it continues to make fresh all-time highs its clearly bullish for now. However the NASDAQ is an excellent example of our current mantra to “remain open-minded”, the pullbacks since the year 2000 are enough to put anyone off their breakfast!
1. March 2000 to December 2002 the NASDAQ fell 83% during the infamous “Tech Wreck”.
2. During the GFC the NASDAQ fell 54% in just over a year.
3. In mid-2015 the NASDAQ fell 19% in only a few weeks on China concerns.
US NASDAQ Quarterly Chart
Thinking about this report enroute to the office this morning, a few things sprung to mind – one of which was the concept of exponential versus linear growth. I’m yet to read a better explanation / description of this than the one provided by Hamish Douglas from Magellan last year so we’ll simply make reference to it here. We’ve included this as it helps to explain the huge share price (and earnings) gains in some of the companies below, and why the very dangerous notion of ‘this time is different’ might just apply in the age of technology we are now experiencing;
Exponential versus linear growth
It is difficult to comprehend that we could rapidly face a radically different world from the advancement of technology, when our own experience suggests that fundamental change is occurring incrementally and at a gradual pace. A reason why we may be underestimating the impact of technological change is that most changes in our life (like ageing, learning, career progression, etc.) occur in a well-established linear trajectory whereas technological progression is exponential.
In exponential growth, a measurement is multiplied by a constant factor for a given unit of time (e.g. computation power doubles every year), whereas for linear growth the measurement is added to incrementally and by a constant factor (i.e. we grow older by one year per year). Early on, it is difficult to feel the difference between linear and exponential growth (i.e. from 1,2,3,4 … to progressions of 1,2,4,8…); however, after 30 iterations the linear sequence is at 30 whereas the exponential sequence is over 500 million. In an exponential world nothing is perceived to be changing in the early stages and then suddenly change starts occurring at an explosive rate. Source; Hamish Douglas, Magellan Financial Group
1. Facebook
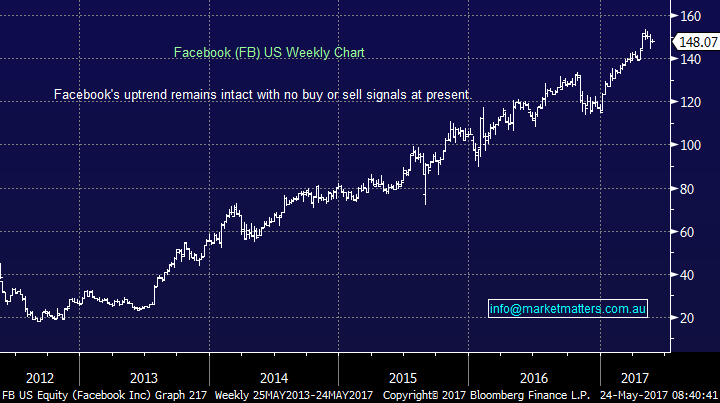
The household name Facebook has enjoyed a strong 7-fold rally since late 2013 as they proved their ability to ‘monetise social media’ – something that Twitter is finding more challenging. If you recall back at the IPO, the valuation was extreme when the stock listed at $38 per share, yet the growth in the business, it’s social reach and ability for extremely targeted advertising has seen the company grow strongly. At listing, Facebook traded on a PE of 85 based on $38 per share. Now, with the stock at $148 per share, it trades on a P/E of 30x – which is not too demanding and highlights to concept of ‘exponential growth’.
Technically, there are no warning signs at present that the trend is about to falter
Facebook (FB) Weekly Chart
2. Amazon
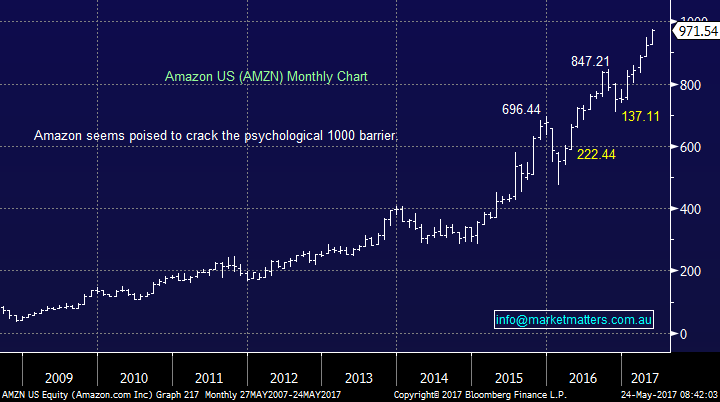
Amazon has been a truly amazing success story from the on-line retailing space which we are about to experience in Australia – by all accounts we are in for a treat in terms of service and value. Gerry Harvey is clearly rattled! The stock has more than tripled since early 2015 but its valuation of 143x does feel very scary – but then again, Facebook grew into its earnings!
There are no technical warning signs at present.
Amazon (AMZN) Monthly Chart
3. Netflix
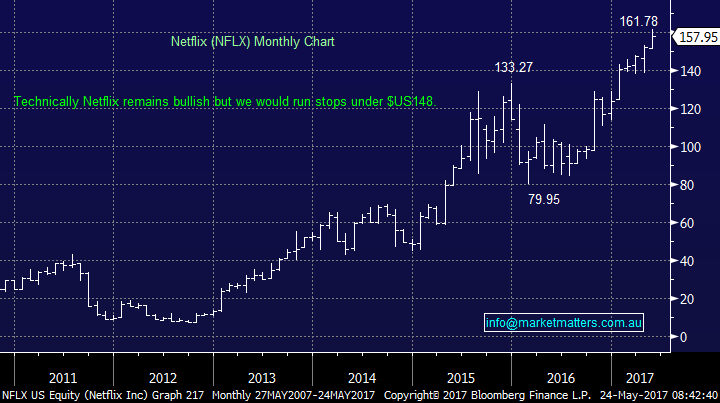
Netflix has struggled a touch compared to its fellow members of the “FANGS” but it continues to go from strength to strength rallying strongly since Donald Trump’s victory last November. In Australia we have not yet enjoyed the full offering from Netflix making it hard to get a handle on the business but it certainly looks destined to put the classic TV stations into the shade over coming years. Similar to Amazon a valuation of ~150x is slightly scary.
There are no technical warning signs at present.
Netflix (NFLX) Monthly Chart
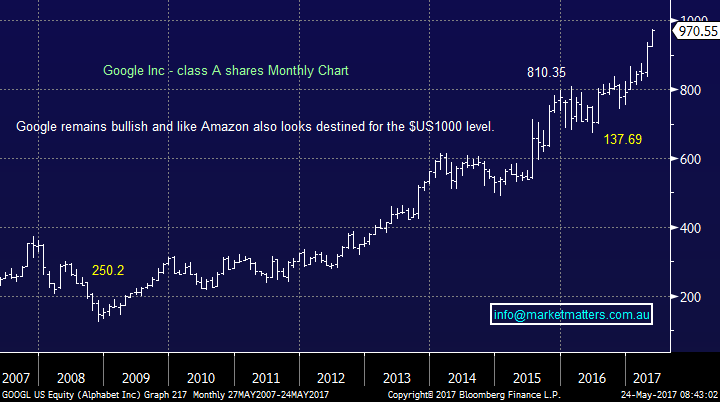
Google (GOOGL) Monthly Chart
Google is another household name within the FANGS which has enjoyed strong gains over recent years. The stock is currently trading on a valuation of ~29x which is not too demanding for a stock in this sector. There are no technical sell signs at present but a short-term pullback does feel close at hand. Periods of consolidation / constructive weakness have proven to be good times to enter this behemoth.
Conclusion (s)
A simple one today, there are no sell signals within the FANG stocks at present, however the concept of exponential versus linear growth is clearly one that we should be considering.
Overnight Market Matters Wrap
· The US markets showed strength in defiance of the recent terror attack in London, ending its session in positive territory last night.
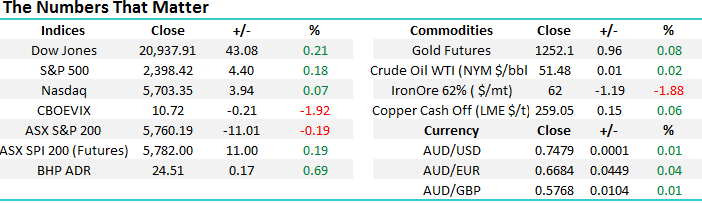
· The Volatility / Fear (VIX) index continues to dissipate in ultra-complacency levels, currently at 10.72.
· Iron Ore had a healthy and expected retracement, off 1.88% overnight, with BHP ending its US session up an equivalent of +0.69% to $24.51 from Australia’s previous close.
· The June SPI Futures is indicating the ASX 200 to open 18 points higher, towards the 5,780 level this morning.
Disclosure
Market Matters may hold stocks mentioned in this report. Subscribers can view a full list of holdings on the website by clicking here. Positions are updated each Friday.
Disclaimer
All figures contained from sources believed to be accurate. Market Matters does not make any representation of warranty as to the accuracy of the figures and disclaims any liability resulting from any inaccuracy. Prices as at 24/05/2017. 8.00AM.
Reports and other documents published on this website and email (‘Reports’) are authored by Market Matters and the reports represent the views of Market Matters. The MarketMatters Report is based on technical analysis of companies, commodities and the market in general. Technical analysis focuses on interpreting charts and other data to determine what the market sentiment about a particular financial product is, or will be. Unlike fundamental analysis, it does not involve a detailed review of the company’s financial position.
The Reports contain general, as opposed to personal, advice. That means they are prepared for multiple distributions without consideration of your investment objectives, financial situation and needs (‘Personal Circumstances’). Accordingly, any advice given is not a recommendation that a particular course of action is suitable for you and the advice is therefore not to be acted on as investment advice. You must assess whether or not any advice is appropriate for your Personal Circumstances before making any investment decisions. You can either make this assessment yourself, or if you require a personal recommendation, you can seek the assistance of a financial advisor. Market Matters or its author(s) accepts no responsibility for any losses or damages resulting from decisions made from or because of information within this publication. Investing and trading in financial products are always risky, so you should do your own research before buying or selling a financial product.
The Reports are published by Market Matters in good faith based on the facts known to it at the time of their preparation and do not purport to contain all relevant information with respect to the financial products to which they relate. Although the Reports are based on information obtained from sources believed to be reliable, Market Matters does not make any representation or warranty that they are accurate, complete or up to date and Market Matters accepts no obligation to correct or update the information or opinions in the Reports.
If you rely on a Report, you do so at your own risk. Any projections are estimates only and may not be realised in the future. Except to the extent that liability under any law cannot be excluded, Market Matters disclaims liability for all loss or damage arising as a result of any opinion, advice, recommendation, representation or information expressly or impliedly published in or in relation to this report notwithstanding any error or omission including negligence.
To unsubscribe. Click Here