Subscribers Questions
The news over the weekend was horrific on the humanitarian front and pretty inconsequential from the financial perspective. The awful attacks in London are actually likely to strengthen Theresa May’s hold on next week’s British election which in theory should be positive for equity markets but it feels simply wrong to be considering financial matters when lives have been lost. Again our prayers are with all the families and friends effected by the weekends atrocities.
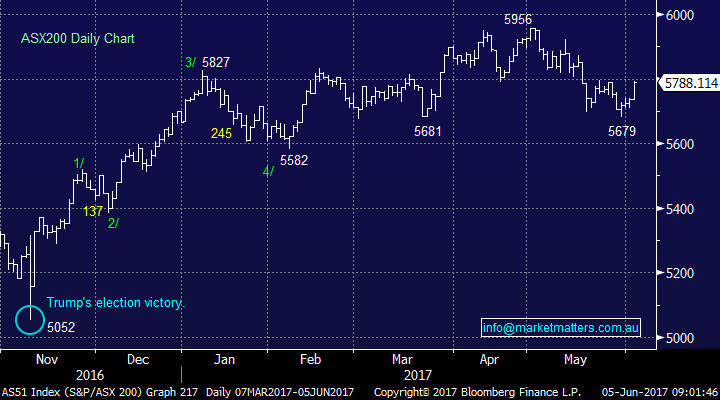
The ASX200 is looking a touch 50-50 as we enter the first full trading week of June. Two small areas are catching our eye for the active investor / trader:
1. A break back under 5740 will be bearish potentially targeting the 5600 zone.
2. The 5800 area provided excellent support for the local market during April and the first half of May, it is likely to become resistance short-term as stocks try and recover.
As we said in the Weekend Report when markets are unclear its best to just sit back and wait for clarity and good risk / reward investing opportunities which will undoubtedly materialise.
ASX200 Daily Chart
Question 1
“Hi there, I have couple of questions:
1. You mention a lot about Sell in May and go away and generally bearish market in May so I just wonder whether it's good to buy Put Option at beginning of May or it depends on each year's condition.
2. Banks shares like WBC are at 5 year resistance level, I know we have bought WBC before but should we buy more given low price now."
Regards – Tony.
Morning Tony, let’s try and answer your 2 questions separately.
Q1. When contemplating buying a Put Option it certainly requires consideration of many scenarios e.g. option volatility, markets position, your investment objectives etc, so it’s difficult for us to make such a definitive call however weak seasonals are certainly one of the things we would look at when considering our positioning.
When we consider the statistics for May / June some other simple actions / inactions make total sense to us:
a. Be patient with any buying, the market often comes to you.
b. Take profit on positions that are close to your target / value areas.
c. Avoid excessive market exposure e.g. buying calls and leverage.
d. Writing calls against positions often makes sense for sophisticated investors.
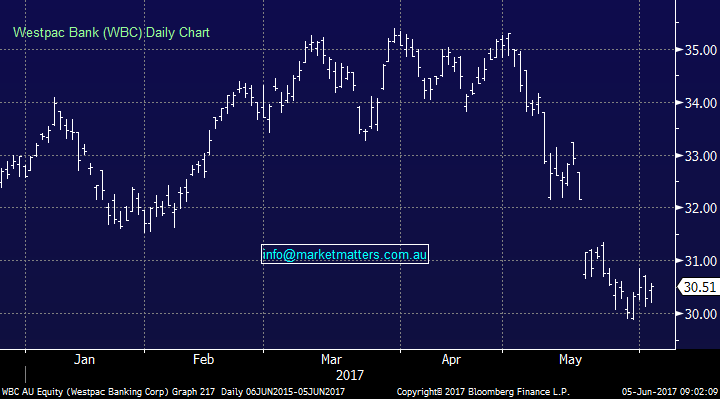
Q2. Westpac (WBC) $30.51 – WBC has corrected close to 15% after trading ex-dividend in May, on current prices the stock currently yields 6.16% fully franked. While there is speculation that the banks will struggle to maintain their dividends moving forward, at current prices they feel in the “cheap” corner. However as many people continue to speculate around the health of the Australian property market its likely to take a while before investors again aggressively embrace our banks.
Unfortunately we’re not quite sure what you mean by WBC’s trading at 5-year resistance area, if anything to us its more in a support area. Technically we have no signal on WBC except the long-term bullish set-up but we are potential buyers into weakness if the ASX200 tests the 5600 area – if not, we will continue to hold our current 5% position.
Westpac (WBC) Weekly Chart
Question 2
“Hi, Top of head General Question Why buy equities v bonds as we approach year end ?” Regards – George.
Hi George, I assume you’re asking whether investors should buy equities ahead of bonds over June, into July. Let’s look at this in 2 halves:
1. Equities – Seasonally the ASX200 represents good buying at the end of June into the new financial year. This is from an overall index viewpoint obviously different stocks will perform differently.
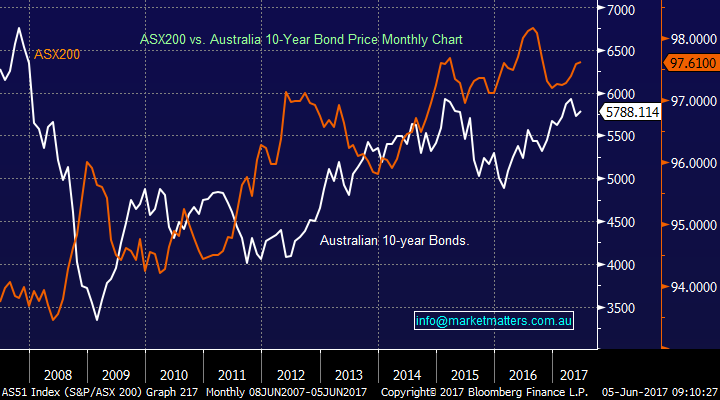
2. Bonds – Since the GFC bonds have fallen in price 55% of the time in May (which push up yields) but only 22% of the time in June. Hence statistically we would only consider buying bonds in June, not May.
As we can see from the following graph bond and equity prices have been fairly well correlated since the GFC but there is a clear argument to prefer bonds to equities over the single month of June. However, we would prefer to simply hold the stocks we like during this tricky period while remaining aware that “tax loss” selling is likely to commence soon leading to ongoing weaknesses for the stock markets underperformers.
Interestingly, Market Matters will be launching an ‘Income Report & Portfolio’ starting in the new Financial Year that will hold fixed income style investments and higher yielding equities. Stay tuned for more information on this.
ASX200 v Australian 10-year bonds Monthly Chart
Question 3
“Thank you Nick and the team for hosting a great night last Tuesday. I regularly attend financial planning events however having sold my practice recently I have not attended an event for a while. I was impressed with the speakers (having listened to them on Sky Business) and commend you on a successful evening.” Many thanks – Peter.
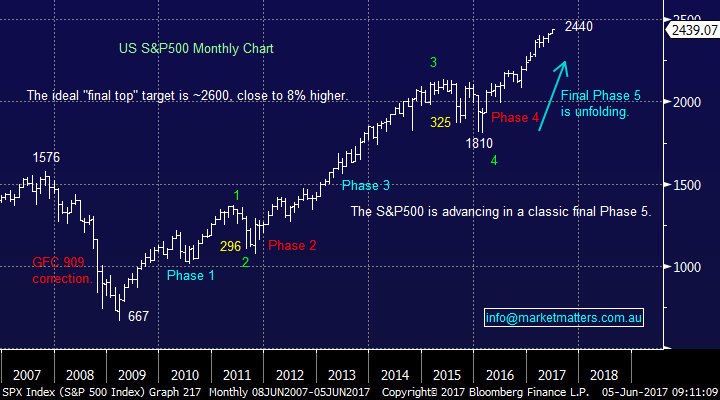
Morning Peter, much appreciated, for a first try we were happy with the outcome, in theory they will only improve! Below is the Monthly US stock market chart that James discussed, time will tell if our targeted 25% pullback unfolds over 2017/8, however we look specifically at statistics / historical trends, and if we do that then we have to be conscious that we are overdue for some type of market shakeout. That said, we doubt it will happen when caution is high, and that is shown through high levels of cash being held by fund managers at the moment, something we covered on the night.
US S&P500 Monthly Chart
Question 4
“Hi MM team, Thanks for continuing to provide meaningful and active advice that affects us as investors on a daily basis. A question for Monday? A couple of weeks ago you suggest a couple of trades for the brave TPM and AWC. One hit, one miss? Can you provide a comment on where to from here on TPM and perhaps VOC? Both for those people that are holders and for those that may be interested?” Many Thanks - Scott
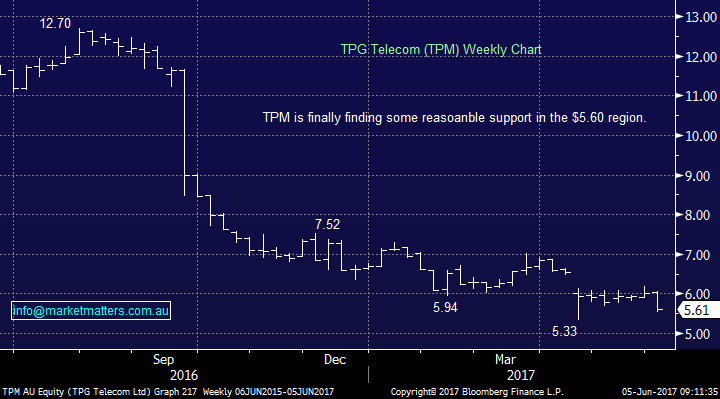
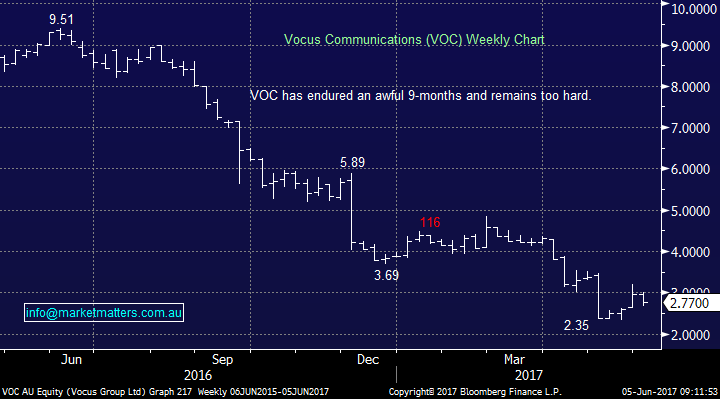
Hi Scott, AWC has definitely been a great win rallying 20% in a few weeks but TPM has again succumbed to selling pressure falling ~6% last week. We now have to be realistic with TPM and VOC by putting them both firmly into the high risk traders basket of shares. The Australian Telco landscape has changed dramatically over the last 12-months led by Broadband changes making it very hard to value these companies with any accuracy moving forward.
We expect both TPM and VOC will have ~15% bounces on an almost a monthly basis but they are not stocks we can own with comfort moving forward. From a trading perspective we could look at TPM ~$5 and VOC ~$2 but stress we are unlikely to be buyers. Importantly these 2 companies are prime candidates for “tax loss selling” over the coming few weeks hence we would not be there now.
TPG Telecom (TPM) Weekly Chart
Vocus (VOC) Weekly Chart
Question 5
“Hi MM, We watched the price of HGGDA open this morning at greater than $45, but no message from MM, why did you not exit when you had stated that $44 was the target. Life is a moving target but how about some alerts on your thinking?” – Thanks Peter and Artemis.
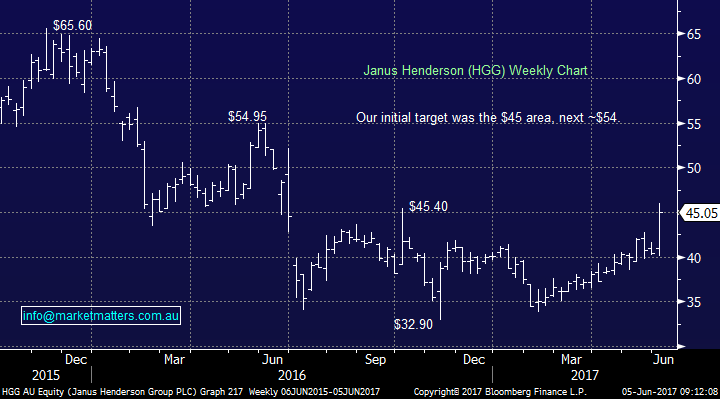
Morning Guys, A great question which hopefully will give insight to our investing logic moving forward. We do often lock in profits once a stock hits our profit target, e.g. Star City ~$5.60, but we also remain open minded and fluid as you suggested. A few important points to mention to explain our current decision to run our Henderson position as opposed to grabbing the 22% profit on offer:
We did mention this on Friday in the afternoon report writing; a couple of standouts in Henderson Group (HGGDA) which traded up to our targeted level of the $44.00 (old $4.40) level and beyond however given we trimmed the position by 3% early in the week to add BT to the portfolio, we’ll continue to hold our 5% position for now. The stock closed up 5.4% to $45.05, while BTT put on 2.34% to close at $11.36. That is the No 1 reason why we held and not sold at our previously outlined target.
2. We remain bullish the financial sector as discussed in the Weekend Report which adds confidence with both the HGG and BTT positions.
3. The explosive nature of the gains for HGG last week identifies ~$54 as a potential target area. We will however be watching very closely this week as in our opinion the stock should now hold over $42.
Janus Henderson (HGG) Weekly Chart
Overnight Market Matters Wrap
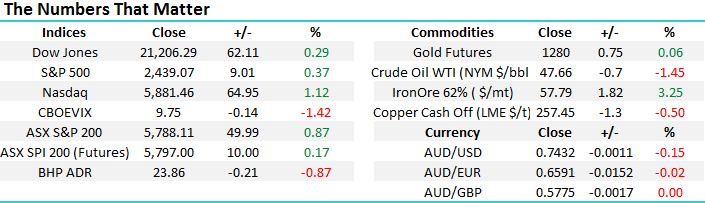
· The US share markets closed higher last Friday, ignoring weaker than expected jobs growth data, with the NASDAQ 100 outperforming the rest of the indices as Amazon reached the US$1000 mark.
· Iron Ore rallied 3.25% higher after recent weakness, particularly from the weaker than expected China Caixin manufacturing PMI data.
· Despite the Iron Ore strength, BHP is expected to underperform the broader market after declining an equivalent of 0.87%in the US from Australia’s previous market.
· The June SPI Futures is indicating the ASX 200 to open marginally higher this morning, towards the 5,795 area and likely test the 5,800 again.
Disclosure
Market Matters may hold stocks mentioned in this report. Subscribers can view a full list of holdings on the website by clicking here. Positions are updated each Friday.
Disclaimer
All figures contained from sources believed to be accurate. Market Matters does not make any representation of warranty as to the accuracy of the figures and disclaims any liability resulting from any inaccuracy. Prices as at 05/06/2017. 8.00AM.
Reports and other documents published on this website and email (‘Reports’) are authored by Market Matters and the reports represent the views of Market Matters. The MarketMatters Report is based on technical analysis of companies, commodities and the market in general. Technical analysis focuses on interpreting charts and other data to determine what the market sentiment about a particular financial product is, or will be. Unlike fundamental analysis, it does not involve a detailed review of the company’s financial position.
The Reports contain general, as opposed to personal, advice. That means they are prepared for multiple distributions without consideration of your investment objectives, financial situation and needs (‘Personal Circumstances’). Accordingly, any advice given is not a recommendation that a particular course of action is suitable for you and the advice is therefore not to be acted on as investment advice. You must assess whether or not any advice is appropriate for your Personal Circumstances before making any investment decisions. You can either make this assessment yourself, or if you require a personal recommendation, you can seek the assistance of a financial advisor. Market Matters or its author(s) accepts no responsibility for any losses or damages resulting from decisions made from or because of information within this publication. Investing and trading in financial products are always risky, so you should do your own research before buying or selling a financial product.
The Reports are published by Market Matters in good faith based on the facts known to it at the time of their preparation and do not purport to contain all relevant information with respect to the financial products to which they relate. Although the Reports are based on information obtained from sources believed to be reliable, Market Matters does not make any representation or warranty that they are accurate, complete or up to date and Market Matters accepts no obligation to correct or update the information or opinions in the Reports.
If you rely on a Report, you do so at your own risk. Any projections are estimates only and may not be realised in the future. Except to the extent that liability under any law cannot be excluded, Market Matters disclaims liability for all loss or damage arising as a result of any opinion, advice, recommendation, representation or information expressly or impliedly published in or in relation to this report notwithstanding any error or omission including negligence.
To unsubscribe. Click Here