How scared should we be of the NASDAQ’s recent weakness?
After its 5.5% correction since May 1st the ASX200 has finally been looking relatively stable but now it’s the international markets who are providing the negative uncertainty for local stocks. On Friday night the high flying NASDAQ-100 tumbled over 4% in just a few hours before bouncing back to close down -2.4%. Sure the tech. index is still up +l8% so far for 2017, compared to only +0.4% for the ASX200, but the likes of Google, APPLE and Amazon have been the perceived rocks of equity markets since way before Donald Trump became US President in late 2016, and now they are ”wobbling”.
As we said in the Weekend Report Fridays tumble is likely to have broken the back of the high flying NASDAQ for at least a few weeks but how are local stocks looking, remember they didn’t go up when the NASDAQ rallied 18% since January 1st so will they fall with them? Two phrases which we both like and often quote appear to be pulling in opposite directions!
1. The NASDAQ is usually the leading index – the NADSDAQ currently looks vulnerable.
2. The ASX200 doesn’t go down without the banks but they now look to have bottomed.
As opposed to calling an unpopular top, or bottom, over the coming week we believe this time the best way to forecast the ASX200 is by letting the market tell us what it wants to do:
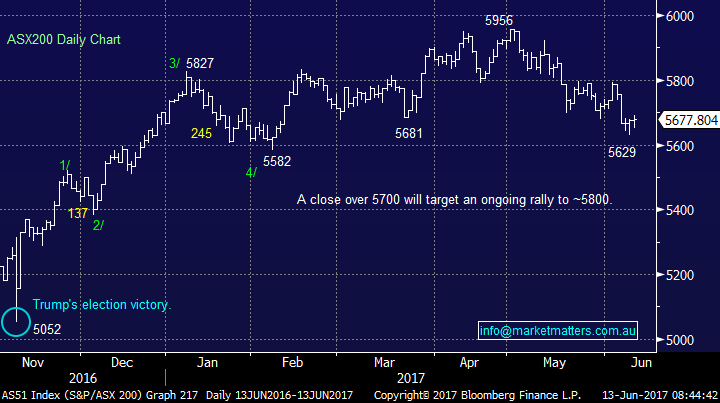
1. If the ASX200 can break over 5700 we believe it should target 5800 minimum fairly quickly.
2. Alternatively if weakness unfolds we would not look to accumulate additional stock until the 5600 region and ideally below.
NB. Our often accurate “Gut feel” is net bullish and we feel the ASX200 will see 5800 before 5600. Today we are going to look at a number of international markets to gauge the current risks to the bull market which began back in March 2009.
ASX200 Daily Chart
US Stocks
US stocks closed lower last night with the S&P500 down 2.4 points having regained virtually all of the days earlier losses having been down almost 12-points in early trade. As expected the weak link was the NASDAQ which closed down 0.6% but again recovering well off its lows, more or less closing on its highs. Two points of interest to us at MM:
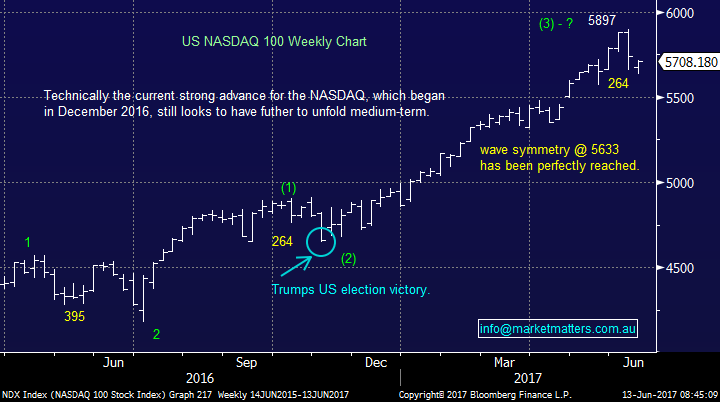
1. The NASDAQ has already achieved our retracement target of 5633, literally to the point.
2. Unless the S&P500 closes below 2400 / 1.2% lower there appears to be no more sinister pullback unfolding at this stage.
US NASDAQ-100 Weekly Chart
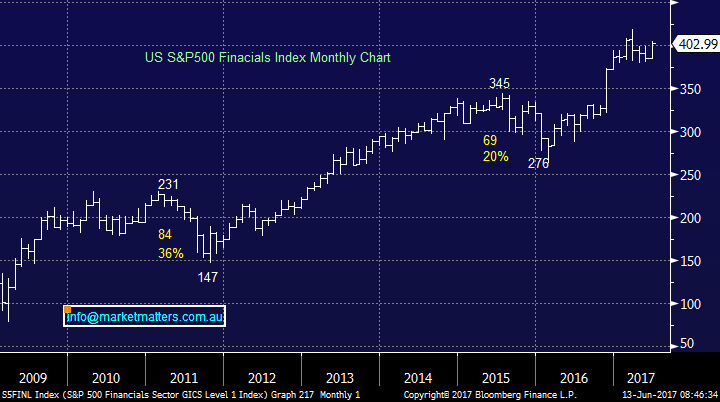
At this point in time we believe interest rates are the key to the recent wild swings within US stocks. The Fed is set to lift interest rates this week which is far more beneficial to the US financial stocks than the Tech sector hence a clear “switch” has unfolded over the last 2 weeks with the NASDAQ falling 4.4% while the banks have rallied over 6%.
US S&P500 Banking Index Monthly Chart
European Stocks
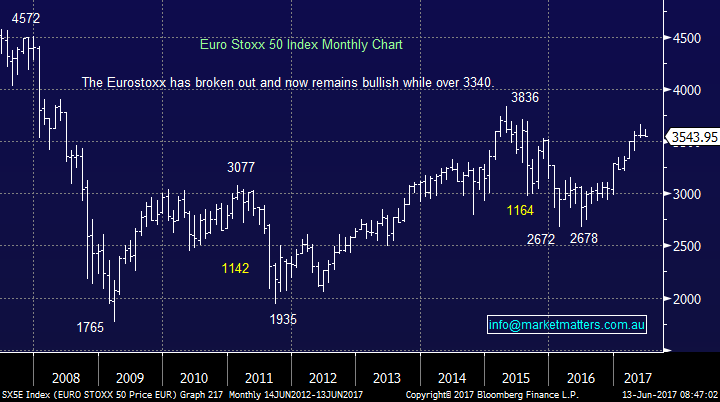
European stocks remain bullish with a few weeks consolidation healthy after the almost 20% rally in 2017. There are no concerning signs at this stage and from a trading perspective we would be buyers of this current weakness / consolidation.
Euro Stoxx Index Monthly Chart
Asian Stocks
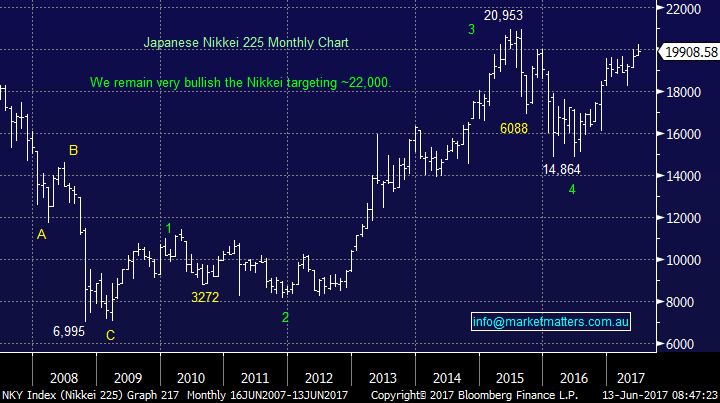
We remain bullish the Japanese Nikkei targeting ~22,000 / 10% higher but short-term we need to see the 19,600 area (~1.5% lower) hold otherwise we would see a 5-7% correction.
Japanese Nikkei Monthly Chart
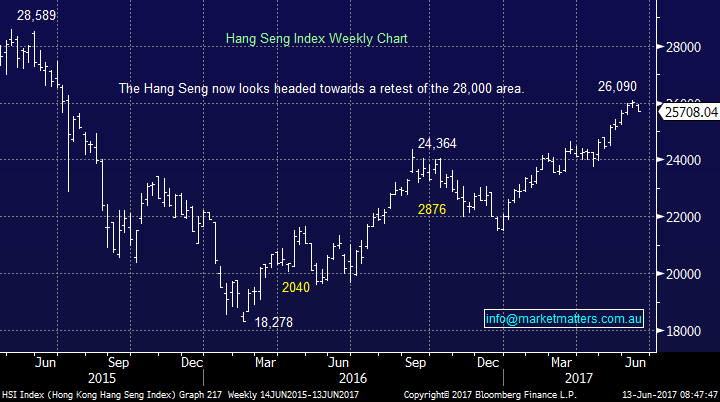
Similarly we remain bullish the Hang Seng and the current small correction is healthy following the ~8% rally since late April.
Hong Kong’s Hang Seng Weekly Chart
Conclusion(s)
We remain bullish equities into 2017 but as we have stated numerous times over recent months the bull market which began back in March 2009 is mature and is highly unlikely to be one way traffic - volatility is likely to increase.
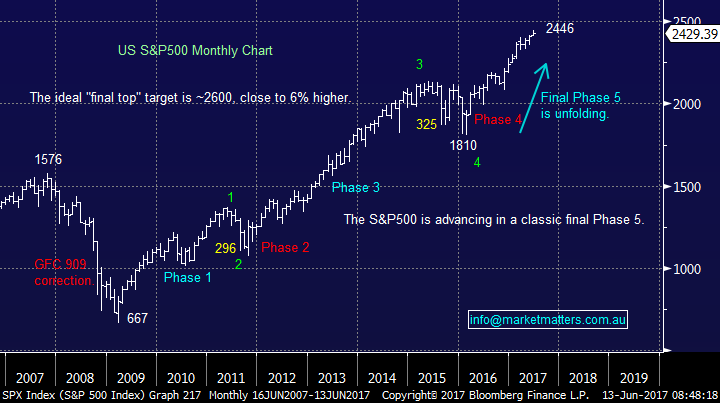
We still see further gains of around 6% for US stocks before the alarm bells will ring for a potential ~25% correction.
US S&P500 Monthly Chart
Overnight Market Matters Wrap
· The US indices ended its session overnight in negative territory, with the NASDAQ 100 hit the most.
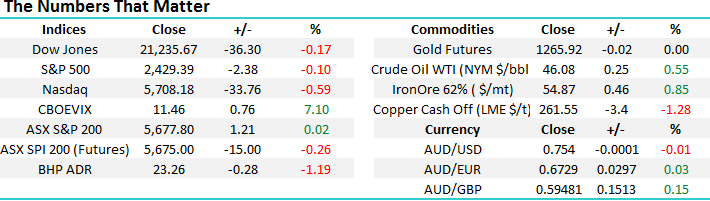
· At the same time, the energy sector was the underperformer of the broader S&P 500 Index, with BHP in the US down 1.19% to $23.26 from Australia’s previous close of $23.25.
· The June SPI Futures is indicating the ASX 200 to open marginally lower this morning, towards the 5,675 level, however we anticipate further downside by the end of the session.
Disclosure
Market Matters may hold stocks mentioned in this report. Subscribers can view a full list of holdings on the website by clicking here. Positions are updated each Friday.
Disclaimer
All figures contained from sources believed to be accurate. Market Matters does not make any representation of warranty as to the accuracy of the figures and disclaims any liability resulting from any inaccuracy. Prices as at 13/06/2017. 8.00AM.
Reports and other documents published on this website and email (‘Reports’) are authored by Market Matters and the reports represent the views of Market Matters. The MarketMatters Report is based on technical analysis of companies, commodities and the market in general. Technical analysis focuses on interpreting charts and other data to determine what the market sentiment about a particular financial product is, or will be. Unlike fundamental analysis, it does not involve a detailed review of the company’s financial position.
The Reports contain general, as opposed to personal, advice. That means they are prepared for multiple distributions without consideration of your investment objectives, financial situation and needs (‘Personal Circumstances’). Accordingly, any advice given is not a recommendation that a particular course of action is suitable for you and the advice is therefore not to be acted on as investment advice. You must assess whether or not any advice is appropriate for your Personal Circumstances before making any investment decisions. You can either make this assessment yourself, or if you require a personal recommendation, you can seek the assistance of a financial advisor. Market Matters or its author(s) accepts no responsibility for any losses or damages resulting from decisions made from or because of information within this publication. Investing and trading in financial products are always risky, so you should do your own research before buying or selling a financial product.
The Reports are published by Market Matters in good faith based on the facts known to it at the time of their preparation and do not purport to contain all relevant information with respect to the financial products to which they relate. Although the Reports are based on information obtained from sources believed to be reliable, Market Matters does not make any representation or warranty that they are accurate, complete or up to date and Market Matters accepts no obligation to correct or update the information or opinions in the Reports.
If you rely on a Report, you do so at your own risk. Any projections are estimates only and may not be realised in the future. Except to the extent that liability under any law cannot be excluded, Market Matters disclaims liability for all loss or damage arising as a result of any opinion, advice, recommendation, representation or information expressly or impliedly published in or in relation to this report notwithstanding any error or omission including negligence.
To unsubscribe. Click Here