Subscribers questions
There was little major news over the weekend presenting us with the ideal opportunity to update our summary of how we see stock markets evolving during 2017/8. We have utilised what MM believe are the clearest index chart patterns, over varying time horizons, that have been following our forecasted roadmap for a number of months / years.
Short-term view
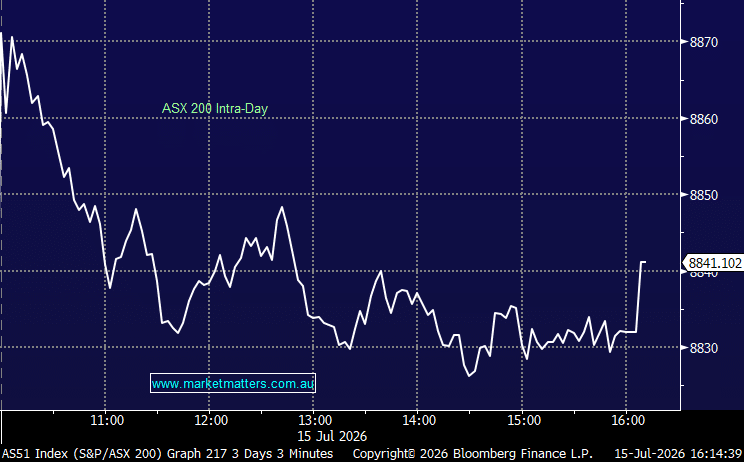
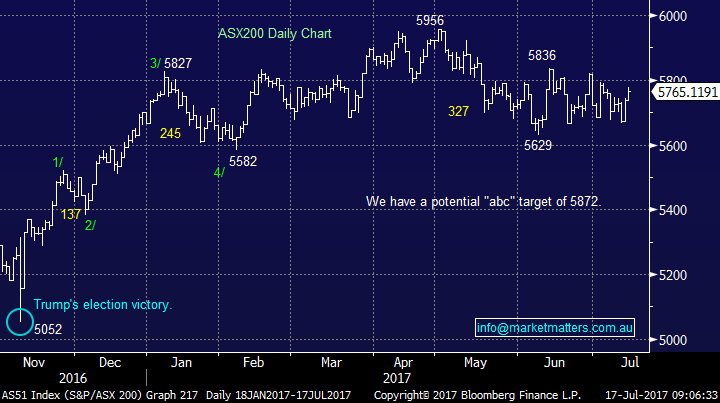
The Australian market has significantly underperformed its US equivalent since early May, with the ASX200 remaining over 3% below the early May high while US stocks have powered to fresh all-time highs! The healthcare, energy, real estate and “yield play” sectors have pressured the local index frustrating the short-term bulls like ourselves.
As we wrote in the Weekend Report, we think there is scope for a short sharp ‘relief rally’ for the local market when details around future bank capital requirements are released (sometime soon), however we cannot expect the support from global equities to continue unabated – and this tempers our short term view. One scenario that currently looks a strong possibility for the ASX200 is a “pop” up towards 5875 followed by another 300-point / 5% decline down towards 5550.
Hence, we are likely to further increase our cash position in the MM Portfolio over coming weeks.
ASX200 Daily Chart
Medium-term view
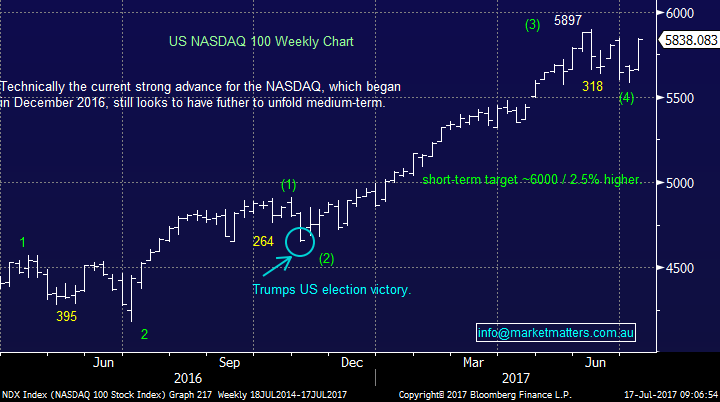
The tech NASDAQ Index has followed a perfect technical path since mid-2016 and until it deviates we will continue to use this as our medium-term guide for global stocks.
We expect a further 2-3% advance to fresh all-time highs following the recent ~4% pullback, to around 6000, during July prior to a decent 7-8% correction.
NASDAQ Weekly Chart
Long-term view
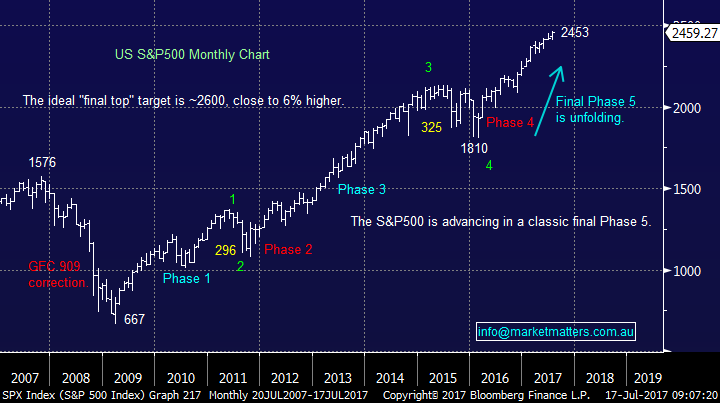
The position of the US S&P500 has enabled us to maintain a bullish outlook while many have become “scarred” way too early, over recent years, moving to cash and subsequently missing some healthy returns from stocks - especially while global interest rates remain at historically low levels. However, alarm bells are slowly ringing on the horizon as the bull market which began back in March 2009 rapidly matures.
We see another 5-6% upside in 2017, in a choppy more volatile manner than over previous years, but importantly moving forward we still see a +20% correction on the horizon, back towards the lows of 2016.
US S&P500 Monthly Chart
Question 1
“Hi MM, you’ve rode the recovery in resource stocks very well over recent weeks, thanks, but do you think it’s time to take some profits?” Regards – Steve.
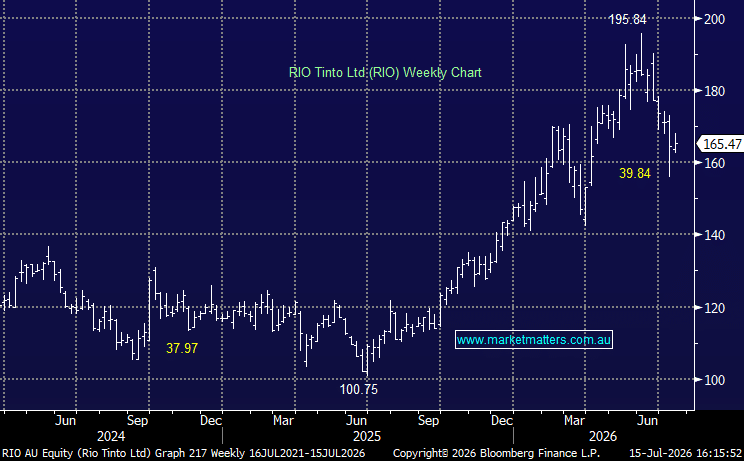
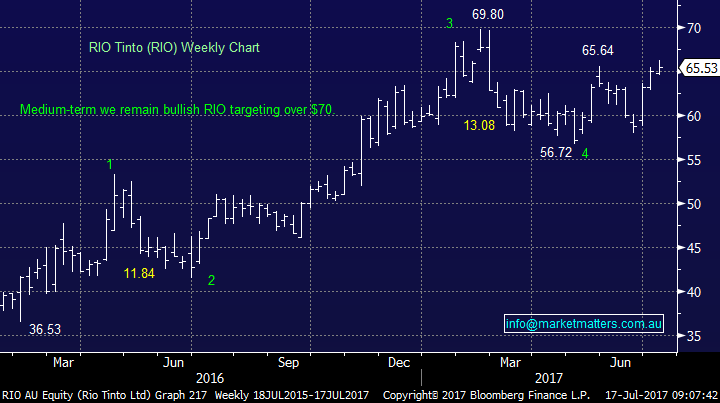
Firstly, thanks Steve, it was a rocky road for a few weeks as commodity prices kept falling but as you say the last 3 to 4 weeks have been great with RIO for example rallying ~14% very quickly. We have a very high exposure to resources from a historical perspective for MM as we hold AWC, BHP, RIO, OZL plus NCM in the gold sector. Importantly even after the recent strength we still like resources in 2017 with our individual targets below:
AWC – We are initially targeting around $2.20, a gain of ~10% however our overall target is towards $2.50. AWC currently resides in both the Platinum and Income Portfolios
BHP – No change, we are targeting a break over $28 this year, or a further 11% gain.
RIO – No change, we are targeting a break over $70 this year, or a further 7% gain.
OZL – We are targeting ~$8.10, or a further 5 / 6% gain.
Hence even though we are expecting to increase the cash position for the MM portfolio in coming weeks unless we witness further quick / sharp gains it’s unlikely we will be selling resource stocks.
With regard to our small gold position in NCM obviously we are currently under water but as most readers know we are looking for weakness to add to this holding – watch this space. Typically, when gold is struggling the rest of the portfolio is doing well and vice versa.
RIO Tinto (RIO) Weekly Chart
Question 2
“Hi, firstly thank you for your informative morning and afternoon reports and guidance. I look forward to my daily read. My question is What are your views on DRP's as against receiving the cash? We hold ANZ with an entry price around $18.50 So the dividend returns are quite good. We take our Dividends as Shares which are now starting to raise the base price, but are also increasing our shareholding. I am not sure which way to go, your input would be appreciated.” - Many thanks Chris
Morning Chris, a slightly difficult question because every investors situation is different and we cannot tender personal advice, so we will make a few comments from a general perspective that we believe should be dominant in the decision-making process:
1. Check out the tax benefits to you personally from the DRP’s with your accountant.
2. Importantly would you buy that stock, ANZ you mentioned above, today at that price? If the answer is no then the decision should be easy – take the cash.
3. Portfolio make-up - investors that utilise DRP’s for years often end up with very unbalanced holdings. Should you buy say ANZ today or are you starting to put all your eggs in one basket?
Hopefully these 3 simple points helped answer your question.
Question 3
“Recently WAM released a list of stocks for 2018, Any thoughts on following stocks: micro-cap companies DTL and Pacific Current Group PAC, small-to-mid-cap companies NEC and Reckon Limited RKN and large-cap companies Woolworths WOW and Origin Energy ORG, Incitec Pivot Limited IPL, BHP plus Jumbo Interactive JIN plus Afterpay Touch Group LimitedAPT”– Lakshan.
Morning Lakshan, I’m sure you understand that we do not believe its fair / professional for us to critique other companies work. WAM (Wilson Asset Management) will have some well researched reasons for their picks for 2018 and time will tell which ones prove profitable. I did a couple of interviews with Matt Haupt who runs their Leaders Fund a few weeks ago and he identified Woolies as his top pick that would continue to do well in the large cap space – mine was Suncorp (SUN).
BUY HOLD SELL; Top performers of FY17

We also talked about the companies that did poorly during the period – and was asked around one dog that could turn around .
BUY HOLD SELL; The Dogs of FY17

One point we would like to make as this bull market matures is we see cycles of sector performance contracting in time hence we are unlikely to make calls for the next 18-months except on an index level e.g. over the last 4 weeks RIO has rallied ~14% while CSL has fallen over 10% - these are both excellent companies but their respective sectors has have gone in / out of favour.
From a purely technical perspective we do like DTL and JIN while obviously we do hold BHP.
Question 4
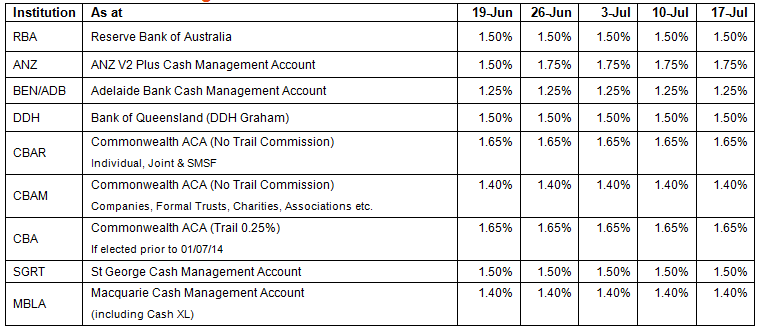
“Hi Guys, can I ask where you are getting the best interestrate on cash for SMSF accounts” - Cheers Ted.
Morning Ted, at call money in a SMSF will get just above the RBA cash rate typically. ANZ V2 has just increased their rates in the last week or so. More can be achieved on Term Deposit however you are then locked up. In terms of accounts I use when dealing for my clients at Shaw and Partners, we use Macquarie CMA or St George, mainly because they talk to our systems and report well within our structures.
Overnight Market Matters Wrap
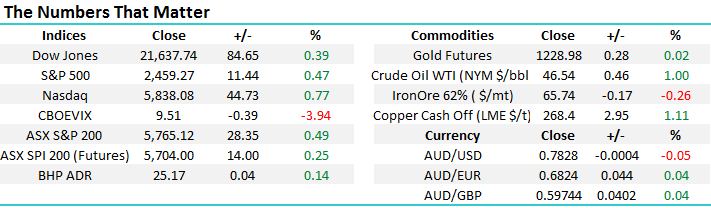
· The US ended its week in good form, with the major indices finishing its session in positive territory, with investors interpreting a less likely chance of an aggressive rate hike cycle.
· US Financials underperformed the broader market, with a number of names starting it’s the US reporting season off mixed from analysts’ expectations.
· Iron Ore remains to creep marginally higher, with BHP expected to outperform the broader market after ending its US session up an equivalent of 0.17% from Australia’s previous close.
· The June SPI Futures is indicating the ASX 200 to open 6 points lower, testing the 5760 level this morning.
Disclosure
Market Matters may hold stocks mentioned in this report. Subscribers can view a full list of holdings on the website by clicking here. Positions are updated each Friday.
Disclaimer
All figures contained from sources believed to be accurate. Market Matters does not make any representation of warranty as to the accuracy of the figures and disclaims any liability resulting from any inaccuracy. Prices as at 17/07/2017. 8.00AM.
Reports and other documents published on this website and email (‘Reports’) are authored by Market Matters and the reports represent the views of Market Matters. The MarketMatters Report is based on technical analysis of companies, commodities and the market in general. Technical analysis focuses on interpreting charts and other data to determine what the market sentiment about a particular financial product is, or will be. Unlike fundamental analysis, it does not involve a detailed review of the company’s financial position.
The Reports contain general, as opposed to personal, advice. That means they are prepared for multiple distributions without consideration of your investment objectives, financial situation and needs (‘Personal Circumstances’). Accordingly, any advice given is not a recommendation that a particular course of action is suitable for you and the advice is therefore not to be acted on as investment advice. You must assess whether or not any advice is appropriate for your Personal Circumstances before making any investment decisions. You can either make this assessment yourself, or if you require a personal recommendation, you can seek the assistance of a financial advisor. Market Matters or its author(s) accepts no responsibility for any losses or damages resulting from decisions made from or because of information within this publication. Investing and trading in financial products are always risky, so you should do your own research before buying or selling a financial product.
The Reports are published by Market Matters in good faith based on the facts known to it at the time of their preparation and do not purport to contain all relevant information with respect to the financial products to which they relate. Although the Reports are based on information obtained from sources believed to be reliable, Market Matters does not make any representation or warranty that they are accurate, complete or up to date and Market Matters accepts no obligation to correct or update the information or opinions in the Reports.
If you rely on a Report, you do so at your own risk. Any projections are estimates only and may not be realised in the future. Except to the extent that liability under any law cannot be excluded, Market Matters disclaims liability for all loss or damage arising as a result of any opinion, advice, recommendation, representation or information expressly or impliedly published in or in relation to this report notwithstanding any error or omission including negligence.
To unsubscribe. Click Here