Subscribers questions
Firstly, a huge thanks to all the subscribers who sent in questions this week, we actually received a record number which we take as a huge compliment! Please keep them coming however confrontational or tricky, we will either answer them in this forum, or directly if necessary.
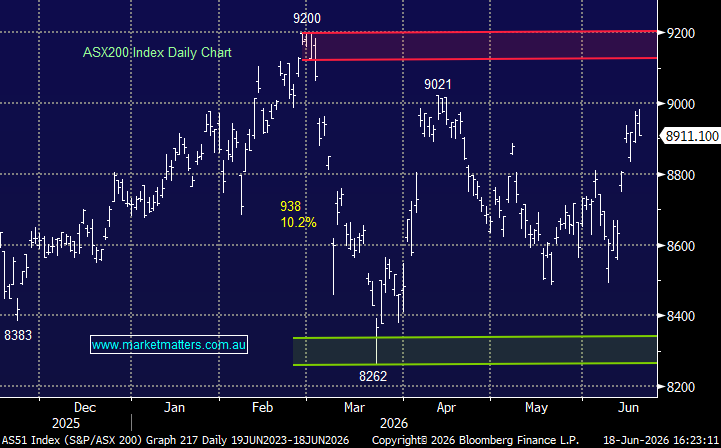
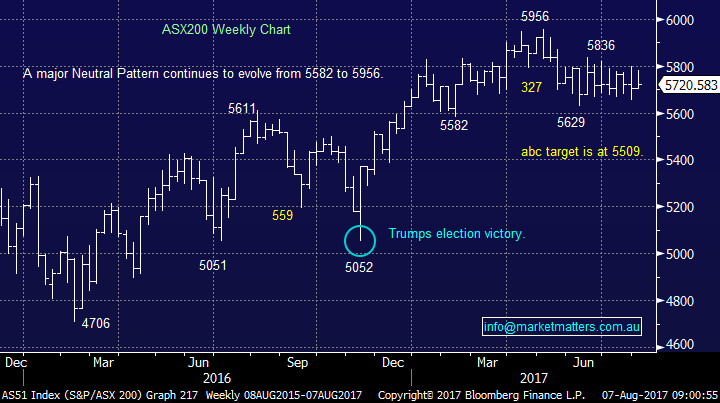
As we have been discussing at length the ASX200 has been trading between 5629 and 5836 for 11-weeks - clearly some volatility feels likely soon. However, as we did touch on in the Weekend Report we prefer the resources sector over banks in the short-term, potentially this may unfold with the moves in effect cancelling each other out, hence leading to ongoing relatively small swings in the overall index.
ASX200 Weekly Chart
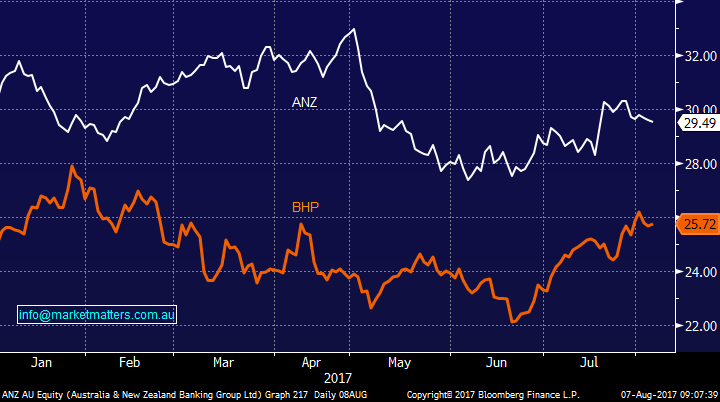
The following graph illustrates the swings in both ANZ and BHP during 2017. Interestingly we actually have to go back until 2014 to see BHP trading at a higher price than ANZ - it had actually been the norm for the previous 10-years.
While it’s a big ask for BHP to again rally over ANZ in absolute terms we do feel the outperformance since late June has further to unfold i.e. BHP has rallied 16.6% since June 21st compared to ANZ which has only gained 7.2%.
ANZ v BHP Daily Chart
Question 1
“Hi Team, doing a wonderful job of leading us through the maze of investing in some of Australia's best companies. My question for Monday subscribers: what are your thoughts on GNC. Has it bottomed now after losing all its outperformance?” – Robert B.
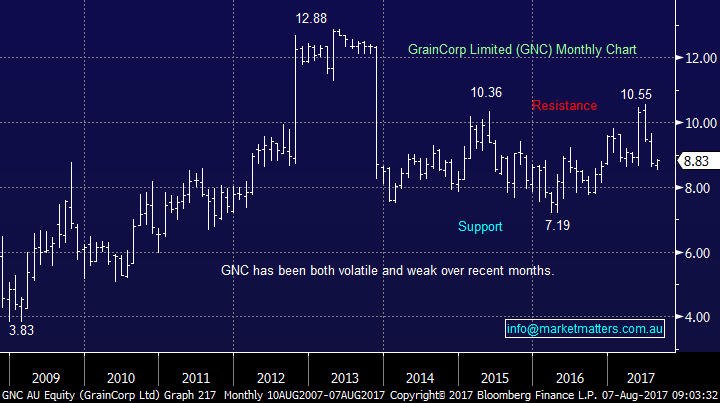
Morning Robert, thanks for both compliment and the question around the Australian grain business. GNC has basically traded between $8 and $10 for the last 5-years, following the government blocked takeover attempt by Archer Daniels at over $13 a share. The company unfortunately remains vulnerable to adverse swings in both commodity prices and the weather – 2 very unpredictable variables.
Considering the company’s profits have fallen from over $200m in 2012 to just over $50m in 2016 we would want to buy GNC closer / under $8 to feel confident of at least 10% upside from our investment. Overall, we do not find GNC an exciting proposition unless takeover interest is reignited.
GrainCorp (GNC) Monthly Chart
Question 2
“Hi team, I'm travelling in Europe at the moment so keeping in touch with market happenings important. Just listened to the first "direct from the desk" and loved it. Wonderful concept. Thanks James and the MM team. Keep up the great work” - Take Care, Barry F.
Morning Barry, much appreciated, we certainly believe it’s a good improvement to the MM service that will be continued – although we’ll try and be a little shorter and to the point next time. Importantly, these are more likely to be adhoc, when specific events arise rather than scheduled updates. And Importantly, they will be done in addition to the MM Video updates, All in all, we’re simply trying as many mediums as possible to enhance communication with subscribers in a timely way. For any subscribers that missed last week’s commentary we have attached below. We can see great value in the concept in fast / news driven busy markets that require insightful explanation.
Link last week’s Direct from the desk.
Question 3
“Hi to MM. my question is what is the best way to short the Dow in the impending down move ...Plus would a short side EFT on the Dow index be of consideration as well” - thankyou Hedley M.
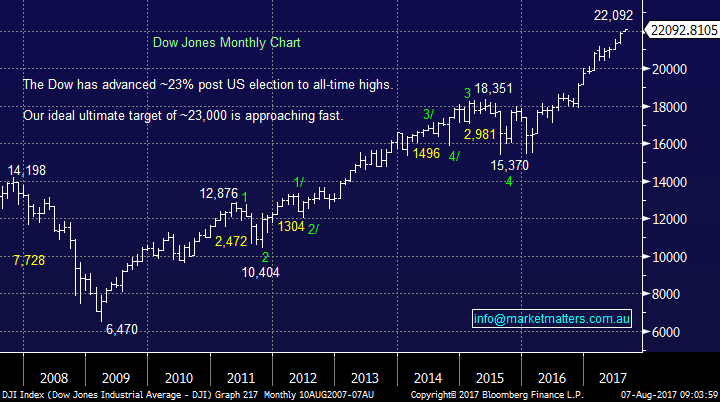
Morning Hedley, thanks for a question on a topical subject as investors get more nervous US equities. The current bull market is now the second longest in history but considering the damage during the GFC that should be no great surprise. Picking tops in stock markets can be a very tricky business e.g. the top in 2015 took 6-months to finally give way before correcting over 16% in fairly quick fashion i.e. picking areas to move portfolio’s significantly to cash is far easier than initiating “trading” shorts.
However, when investors / traders do successfully position themselves correctly for decent downturns the returns can be significant and fast. There are many more vehicles for trading the Dow from the short side than 10-years ago when it would basically have been the futures market:
1 The futures market remains the purest way to “short” markets but these are for sophisticated players.
2 Betashares run an ETF (BBUS) which is designed to give you the magnified 200% to 275% inverse return to the US market
US Dow Jones Monthly Chart
Question 4
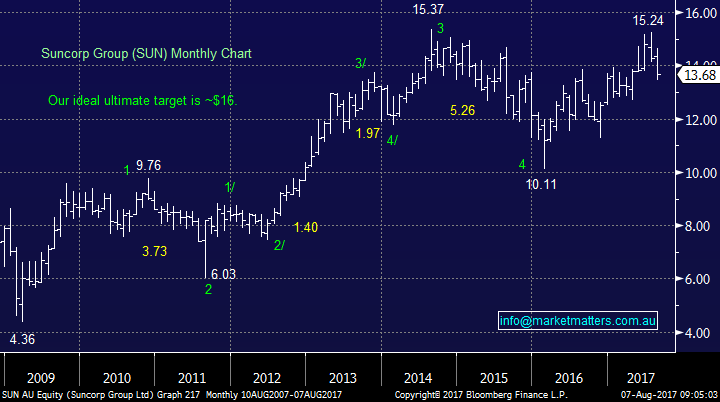
“Hi there, the recent SUN alert has confused me. You have had Suncorp in the Income Portfolio since inception on 5th July, so why are you saying you are now adding it to the portfolio? Could you please explain.” – Thanks Paul H.
Morning Paul, indeed – this was confusing. The correct wording should have been we are adding to our position in Suncorp rather than adding Suncorp to the Income Portfolio.
Suncorp (SUN) Monthly Chart
Question 5
“Hi there, can you please advise more detail re the email sent about MM running a client’s SMSF? i.e. minimum value and ongoing cost, trades etc.” – Thanks Lawrence.
Thanks Lawrence – we’ve had a lot of interest around this. To be clear, Market Matters does not provide personal advice on client portfolios, we simply refer this to James and his team within Shaw and Partners. James is a major shareholder in Market Matters and the Primary Contributor – penning the majority of content. Shaw also holds a 20% shareholding in Market Matters.
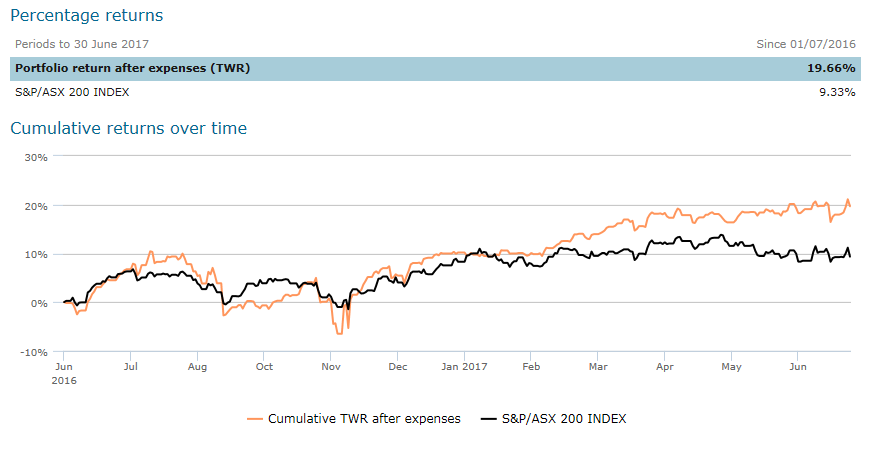
James and his team focus on Managed Accounts, which can include SMSF, where a client would invest an amount of money (250k minimum). James and his team would manage the funds on an ongoing basis in a way that suits an investors personal circumstances. Although each portfolio is individually managed, and past returns are by no means a reliable indicator of future results, an example of returns over varying time frames are outlined below (return are after all fees). Fees include a portfolio fee ranging from 0.90% - 1.2% + GST depending on account size, and a transaction fee ranging from 0.20% to 0.50% with a minimum of $50 per transaction. For more details, please get in touch.
5 years
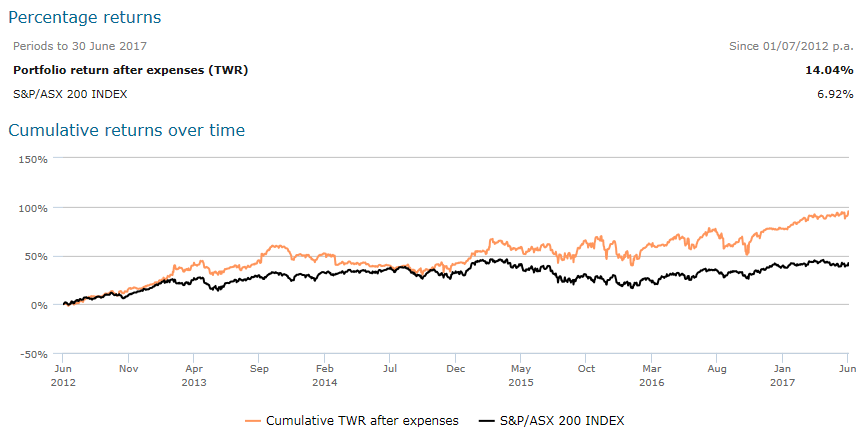
1 year
**Please note; Past Performance is not a reliable indicator of future performance, please refer to our disclaimer at the base of this email**
Question 6
“You mention risk/reward on your stock considerations and alerts. At the risk of looking naive can you please reward me by explaining your rules, formulae that you use.” – Thanks Bruce B.
Morning Bruce, an excellent question that could easily fill this whole report hence we will try and be succinct and to the point this morning. We believe it is a 3-dimensional equation to create good risk / reward which is probably best explained by an example:
1 If we identify an opportunity that we believe has a 50-50 chance of success but yields a 5x greater potential profit than loss when wrong we would regard this as a worthwhile position.
2 Alternatively if we see an opportunity that looks likely to have an 80% success rate but only a 50-50 profit / loss potential this still remains a worthwhile opportunity to undertake
In other words, we are looking at the simple mathematics of profit potential v risk amount and our perceived likelihood of success.
Question 7
“Following recent emails with James around Newcrest, I am now confused about the consistency of information from within MM as I asked (within the first few weeks of joining) what was the duration of the short, medium and long- term buy options and I was informed that "short equated to around a one month, medium approximates 3 months and long is longer". As such this was why I asked the question last week.” - Many thanks Wayne P.
Morning Wayne, a great question if a little tricky! I would actually acknowledge that when you look at our portfolio on the MM website the “Time Horizon” tab is perhaps the weakest as our market perception is understandably fluid. A great example being OZL over recent months that was taken as a short-term position which traded a few cents below our profit target only to dive $2. We remained confident in the stock, especially due to our current view on the sector, hence we ran the position longer than expected prior to taking a profit instead of a panic loss.
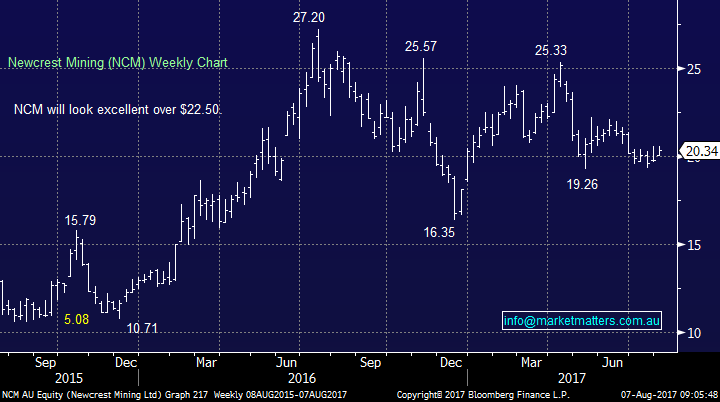
The quoted timeframes can only be used as a guide in markets which constantly evolve and our opinion may understandably change. Our “trading positions” are historically realized in under a month, the investment positions do vary and the NCM you mentioned should probably now become a medium-term holding as we look to increase our gold exposure into weakness. We apologise for any confusion.
https://www.marketmatters.com.au/blog/post/market-matters-platinum-portfolio-6th-august-2017/
Newcrest (NCM) Weekly Chart
Question 8
“Hi, I have got a question about GMA stock, your report said its yield is 8.5%, however, when I calculate it 0.14/3.2=4.3% only, please help me clarify the figure.” - Thanks Michael S.
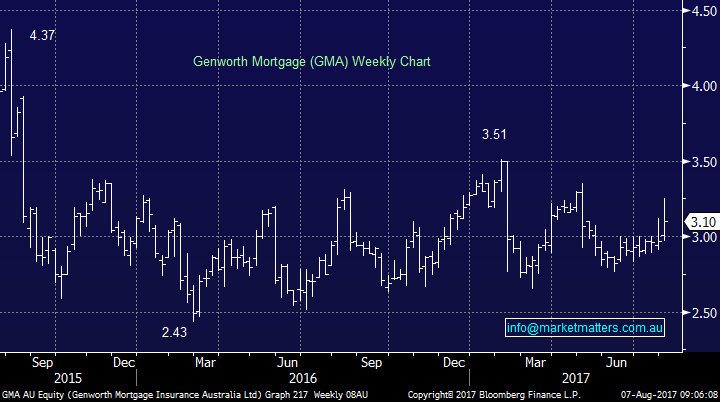
Hi Michael, GMA pays two dividends annually, one in August and the other in February. For this calendar year that’s going to be 28c (fully franked) which at Fridays closing price actually equates to ~9% p.a. plus franking for those that can use the tax benefits.
As we discussed previously GMA have a very strong cash position making us feel comfortable that this healthy dividend should remain intact over the coming years.
Genworth (GMA) Weekly Chart
Overnight Market Matters Wrap
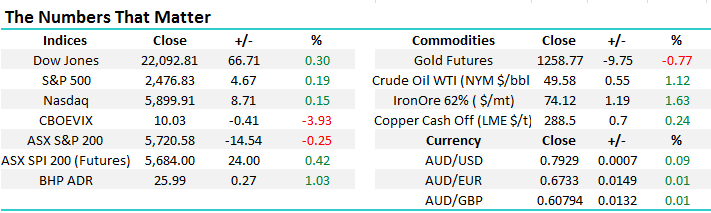
· The US ended their Friday session in the black, with the Dow on its eighth winning streak, breaking record highs each time as positive sentiment grows after the release of good employment data (further reason for the US Fed to increase its key interest rates).
· On the commodities front, risk was seen as on with Oil up 1.12% and Iron Ore 1.63%. BHP is expected to outperform the broader market after ending its US session up an equivalent of 1.03% from Australia’s previous close.
· The June SPI Futures is indicating the ASX 200 to open 25 points higher towards the 5745 level this morning. However, it is expected to be a quiet session as it is bank holiday today in some parts of Australia.
Disclosure
Market Matters may hold stocks mentioned in this report. Subscribers can view a full list of holdings on the website by clicking here. Positions are updated each Friday.
Disclaimer
All figures contained from sources believed to be accurate. Market Matters does not make any representation of warranty as to the accuracy of the figures and disclaims any liability resulting from any inaccuracy. Prices as at 07/08/2017. 8.00AM.
Reports and other documents published on this website and email (‘Reports’) are authored by Market Matters and the reports represent the views of Market Matters. The MarketMatters Report is based on technical analysis of companies, commodities and the market in general. Technical analysis focuses on interpreting charts and other data to determine what the market sentiment about a particular financial product is, or will be. Unlike fundamental analysis, it does not involve a detailed review of the company’s financial position.
The Reports contain general, as opposed to personal, advice. That means they are prepared for multiple distributions without consideration of your investment objectives, financial situation and needs (‘Personal Circumstances’). Accordingly, any advice given is not a recommendation that a particular course of action is suitable for you and the advice is therefore not to be acted on as investment advice. You must assess whether or not any advice is appropriate for your Personal Circumstances before making any investment decisions. You can either make this assessment yourself, or if you require a personal recommendation, you can seek the assistance of a financial advisor. Market Matters or its author(s) accepts no responsibility for any losses or damages resulting from decisions made from or because of information within this publication. Investing and trading in financial products are always risky, so you should do your own research before buying or selling a financial product.
The Reports are published by Market Matters in good faith based on the facts known to it at the time of their preparation and do not purport to contain all relevant information with respect to the financial products to which they relate. Although the Reports are based on information obtained from sources believed to be reliable, Market Matters does not make any representation or warranty that they are accurate, complete or up to date and Market Matters accepts no obligation to correct or update the information or opinions in the Reports.
If you rely on a Report, you do so at your own risk. Any projections are estimates only and may not be realised in the future. Except to the extent that liability under any law cannot be excluded, Market Matters disclaims liability for all loss or damage arising as a result of any opinion, advice, recommendation, representation or information expressly or impliedly published in or in relation to this report notwithstanding any error or omission including negligence.
To unsubscribe. Click Here