It’s not just the US rallying on only a few stocks!
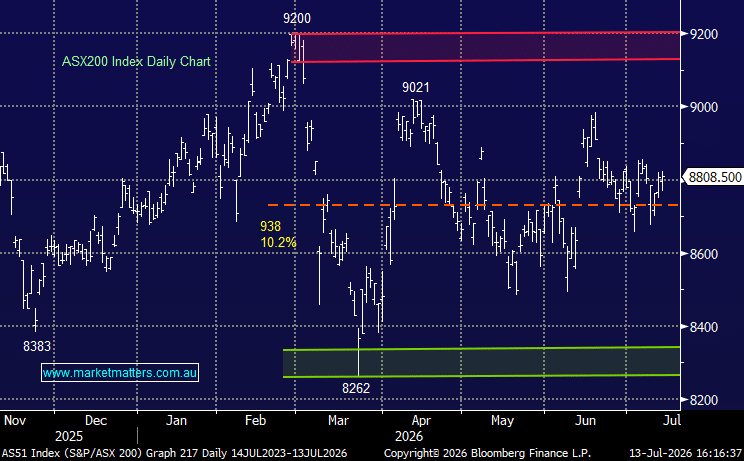
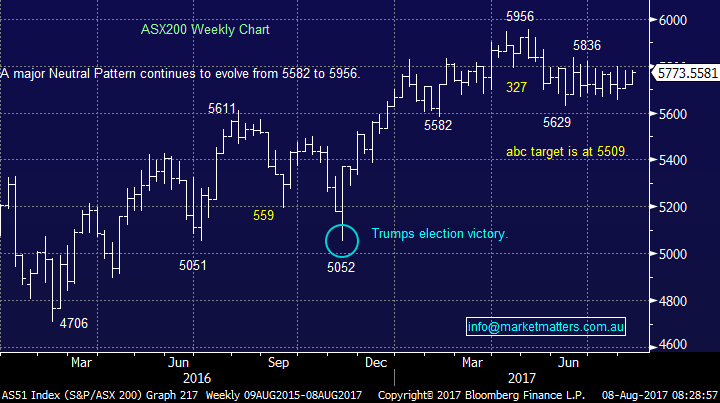
The ASX200 enjoyed a strong day yesterday rallying 53-points / 0.93% strongly assisted by a bounce in our banks and continued strength in the iron ore sector. Turnover was low due to the bank holiday but there was a clear dearth of sellers. The index continues to remain firmly within its trading range of the last 12-weeks i.e. between 5629 and 5836. While our preference is for a test of 5500 in the next 2-months its suddenly feeling a lot further away than last Thursday when the market was challenging 5700.
ASX200 Weekly Chart
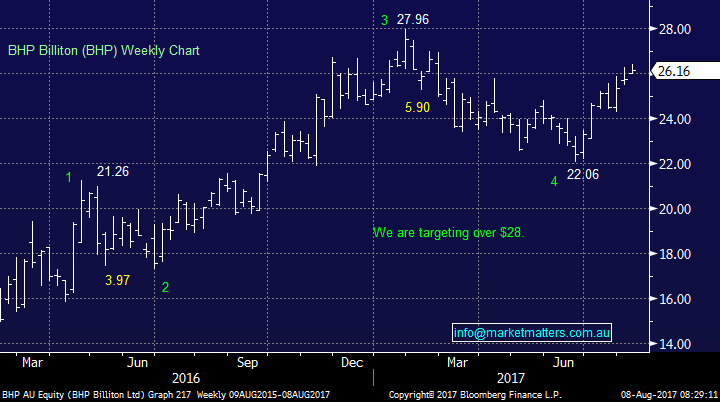
Most analysts appear to have got the recent impressive recovery in iron ore wrong. Hence following the almost 40% gain by the bulk commodity, since mid-June’s $US53.36/tonne low, we are now seeing a few big banks revise their numbers e.g. Deutsche Bank just increased its iron ore forecast by $10/t. We remain bullish the likes of BHP and RIO over coming weeks / months but the more we see prominent analysts turn bullish the happier we will be to take profit in our targeted areas e.g. Over $70 for RIO and above $28 for BHP.
Last night BHP made fresh 2017 highs on the $US ADR market and is set to open over $26.50 locally with the strong $A restraining the comparative advance on the local market, for now.
BHP Billiton (BHP) Weekly Chart
US Stocks
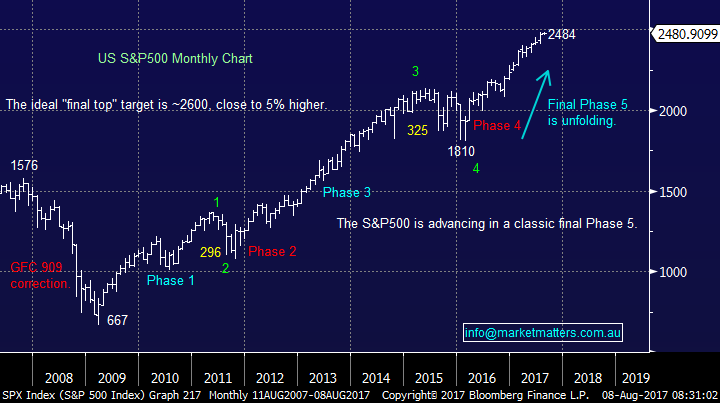
US equities were firm again last night led by the NASDAQ which gained 0.6%. The S&P500 has now traded around the 2480 area for 4-weeks aiding our local indexes lack of motivation to move in either direction.
There is no change to our current view that we believe a strong possibility exists for +5% correction by US stocks in the short-term.
US S&P500 Chart
It’s not the whole market rallying!
Over recent weeks we have discussed the lack of breadth which is driving US equity markets higher e.g. By mid-May almost 50% of the S&P500’s gain during 2017 has been provided by only 10 stocks and almost 30% of its gain has remarkably been generated by just 5 companies i.e. APPLE, Facebook, Amazon, Google and Microsoft. The obvious standout is that the tech names are dominating the markets gains.
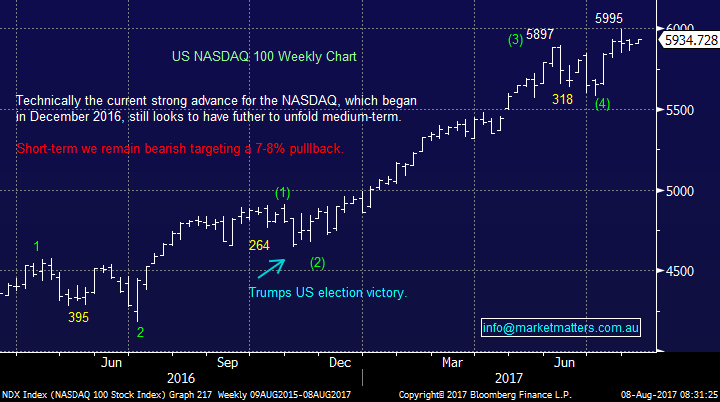
However, the NASDAQ fired a warning shot around its vulnerability in June when it fell 5.4% in relatively fast time. While there are clearly no bearish signs at present we stick with our opinion that US stocks are poised for a ~5% correction led by the NASDAQ which we actually feel is likely to fall closer to 7% - there’s certainly plenty of profits to be taken off the table if we get a period of nervousness.
US NASDAQ Weekly Chart
The story in Hong Kong is arguably even more worrisome with one stock, Tencent Holdings Ltd, accounting for around a quarter of the Hang Seng’s gain this year. The Index has actually gained an impressive 26% since the start of 2017 with just seven of the 49 stocks in the index accounting for ~70% of the total market gain.
However, a major reason for the uneven advance is of even greater concern to MM i.e. Chinese investors are causing the phenomenon, buying Hong Kong’s big-name shares as they funnel cash into the former British colony through exchange links - to the tune of over $35bn this year alone. The stocks on their shopping list include Tencent, Ping An, China Life Insurance Co. and HSBC Holdings Plc. There appears to be no underlying belief that the shares are cheap / well valued, it’s all about parking money in the autonomous territory.
Two interesting scenarios have happened to me in the last week or so, both in Taxi rides with Chinese drivers. 1. Assured me property was going to crash given the massive rise it has seen in recent years & 2. Buy Hong Kong listed shares as they ‘cannot fall’ with all this money pouring in from China.
In terms of property I’m in the process of selling in Sydney after having bought so clearly I don’t like that assertion, however what gives me some peace is that the ‘consensus call’ is for a drop, so it probably won’t happen – and standing back, the price gains in property over the last 10 years has been around 8% per annum so not excessive.
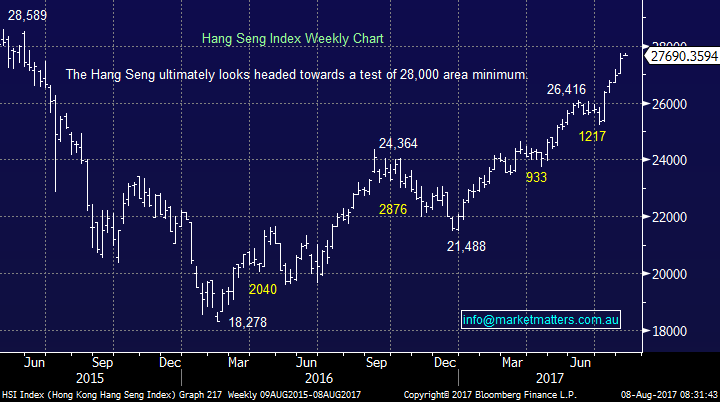
While the rally remains unrelenting it’s certainly not one I would chase at current levels after we’ve been bullish all year. The Hang Seng has corrected 9.4% and 11.8% since early 2016, perhaps another wakeup call is close at hand as markets can undoubtedly always fall
Hong Kong’s Hang Seng Index Weekly Chart
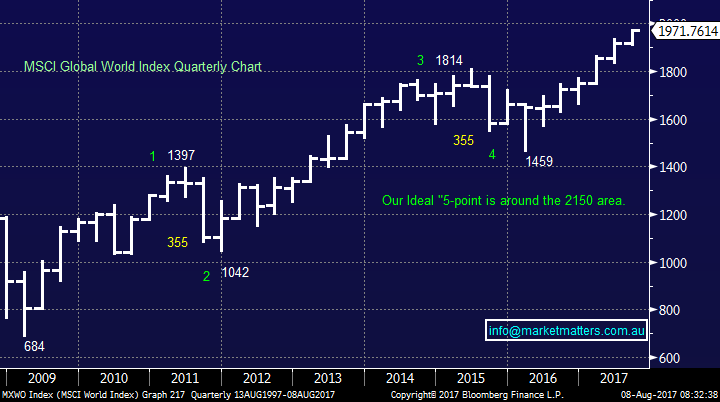
The following chart is one subscribers are likely to see at least once every 1-2 weeks as MM keeps a close eye on this global basket of shares. We have been targeting around the 2150 as an ideal area for us to significantly increase our cash position, this is ~9% higher than last nights close. However, 2-important points to keep in mind:
1 Before the major high in mid-2015, which led to a 19.6% correction, the MSCI Global World Index gave us a clear warning in late 2014-when it retraced 11%.
2 Also, before the horrendous crash in October 1987, when the Dow fell 40% in one month, it fell 10.5% in April-May of the same year – which was a big moved for that time.
Markets very often give investors a warning that all is not well and it’s such a “warning style pullback” that we are looking for at present.
MSCI Global World Index Quarterly Chart
Conclusion (s)
Our view on stocks both locally and overseas remains the same. We are bullish through 2017 / 8 but volatility should pick up soon as the bull market which commenced in March 2009 slowly matures.
We do still see a significant +20% correction on the horizon but there are no major warning signs - just yet.
Overnight Market Matters Wrap
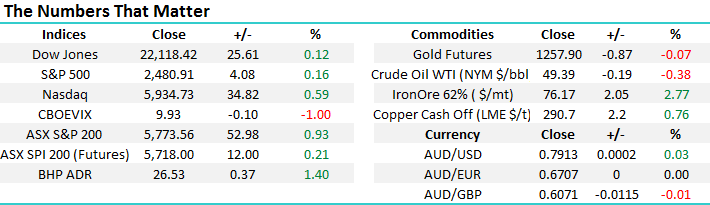
· The US continued its recent strength, with the Dow setting its ninth straight record high at 22,118 following a strong quarterly earnings period.
· Both BHP and RIO were around 2% firmer in US trading as iron ore jumped 2.5% to over $76/t as China steel demand continued to squeeze prices higher. Base metal prices were generally firmer with copper in particular at around two year high of US$2.90/lb. BHP is again expected to outperform the broader market after ending its US session up an equivalent of 1.4% from Australia’s previous close.
· The oil price however was lower on concerns that OPEC and non OPEC members will lift supply in response to the recent jump in prices. The A$ was also slightly weaker hovering just above 79c. The futures are pointing to a 0.2% firmer opening on the ASX.
· The September SPI Futures is indicating the ASX 200 to open 6 points higher, towards the 5780 level this morning.
Disclosure
Market Matters may hold stocks mentioned in this report. Subscribers can view a full list of holdings on the website by clicking here. Positions are updated each Friday.
Disclaimer
All figures contained from sources believed to be accurate. Market Matters does not make any representation of warranty as to the accuracy of the figures and disclaims any liability resulting from any inaccuracy. Prices as at 08/08/2017. 8.00AM.
Reports and other documents published on this website and email (‘Reports’) are authored by Market Matters and the reports represent the views of Market Matters. The MarketMatters Report is based on technical analysis of companies, commodities and the market in general. Technical analysis focuses on interpreting charts and other data to determine what the market sentiment about a particular financial product is, or will be. Unlike fundamental analysis, it does not involve a detailed review of the company’s financial position.
The Reports contain general, as opposed to personal, advice. That means they are prepared for multiple distributions without consideration of your investment objectives, financial situation and needs (‘Personal Circumstances’). Accordingly, any advice given is not a recommendation that a particular course of action is suitable for you and the advice is therefore not to be acted on as investment advice. You must assess whether or not any advice is appropriate for your Personal Circumstances before making any investment decisions. You can either make this assessment yourself, or if you require a personal recommendation, you can seek the assistance of a financial advisor. Market Matters or its author(s) accepts no responsibility for any losses or damages resulting from decisions made from or because of information within this publication. Investing and trading in financial products are always risky, so you should do your own research before buying or selling a financial product.
The Reports are published by Market Matters in good faith based on the facts known to it at the time of their preparation and do not purport to contain all relevant information with respect to the financial products to which they relate. Although the Reports are based on information obtained from sources believed to be reliable, Market Matters does not make any representation or warranty that they are accurate, complete or up to date and Market Matters accepts no obligation to correct or update the information or opinions in the Reports.
If you rely on a Report, you do so at your own risk. Any projections are estimates only and may not be realised in the future. Except to the extent that liability under any law cannot be excluded, Market Matters disclaims liability for all loss or damage arising as a result of any opinion, advice, recommendation, representation or information expressly or impliedly published in or in relation to this report notwithstanding any error or omission including negligence.
To unsubscribe. Click Here