Market Matters Morning / Weekend Report Monday 28th August 2017 (BHP, OZL, VOC)
Firstly, a big apology to all our subscribers for our lack of Weekend Report on Sunday due to technical difficulties - hopefully this morning’s more comprehensive am version plus chart pack makes amends.
Last week the local market was again almost chaotic “under the hood” / on the stock level but in contrast it was practically in a slumber on the index level. The ASX200 slipped just 0.1% while trading in a very tight 82-point / 1.4% range, not a bad effort considering the banks, healthcare, insurance, real estate, retail and telco sectors all closed in the red. We are about to commence the 15th week of range trading between 5629 and 5836 i.e. an extremely tight 3.5% band. The market was primarily supported by the energy and resources sector which is excellently illustrated by the participants in the major winners / losers for the week:
Winners : Flight Centre (FLT) +6.2%, Perpetual (PPT) +10.6%, Santos (STO) +11.2%, Oil Search (OSH) +8.6%, Fortescue (FMG) +9.1%, RIO Tinto (RIO) +6.6%, BHP Billiton (BHP) +5.1%, QANTAS (QAN) +5.6% and Sydney Airports (SYD) +6.2%.
Losers : Healthscope (HSO) -17%, IAG Insurance (IAG) -5.2%, Bluescope Steel (BSL) -20%, Vocus Communications (VOC) -23.6% and QUBE Holdings (QUB) -7.1%.
Apart from the winners being dominated by resource stocks, the 2 clear standouts are firstly almost twice as many stocks in the ASX200 rallied by over 5% compared to those that fell by the same degree and secondly all the stocks that moved by over 15% were in the losers column i.e. this market has no tolerance for bad news.
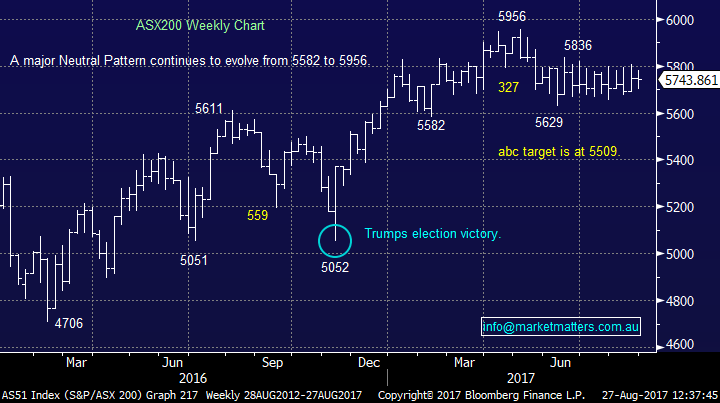
Let’s yet again look at the ASX200’s “trading patterns” which continue to hold the ASX200 as we enter the conclusion of August:
- Short-term Neutral Pattern between 5629 and 5836 – 14 weeks.
- Medium-term Neutral Pattern between 5582 and 5956 – 29 weeks.
- August’s range to-date is 5674-5806 i.e. 132-points, compared to July’s of 146-points.
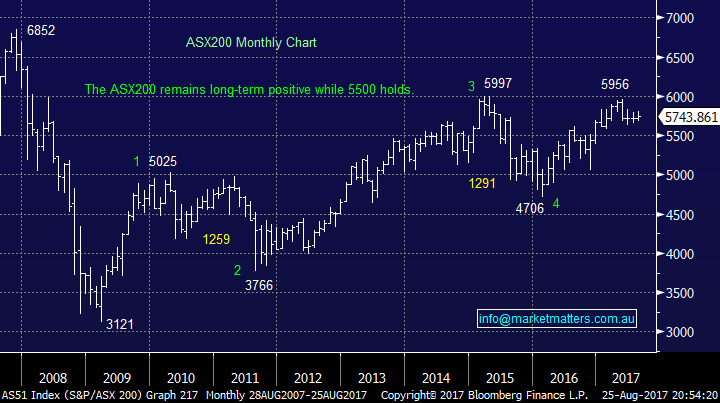
While technically MM is ideally still targeting a further ~200-point correction towards the 5500 area i.e. ~4% lower in August / September we remain conscious that the local market has now ignored a few shaky weeks by US stocks, with buying quickly emerging into any decent declines.
The MM Growth Portfolio is now holding 11% cash following our purchase of Healthscope (HSO) ~$1.76 level, we will update our “shopping last” later in this report, plus of course we continue to evaluate any panic style opportunities from stocks that report during the conclusion of this season.
ASX200 Weekly Chart
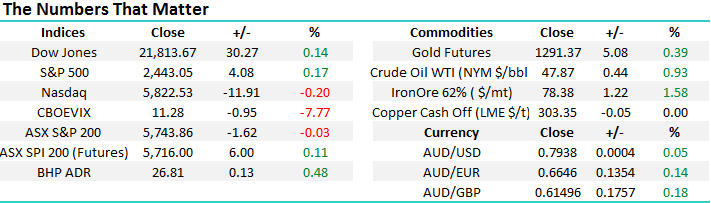
Global Indices
In the bigger picture while we believe the bull market for equities which began back in March 2009 is approaching completion we still don’t believe it’s yet time to jump ship. Ideally stocks will experience increased volatility as they climb the ever steepening wall of worry towards our long-term target (s).
However we remain confident that US stocks are looking for / have found a decent top at least for now – note its prudent to give bull markets the benefit of the doubt, they can often have one final push higher but on balance this is not our preference for now.
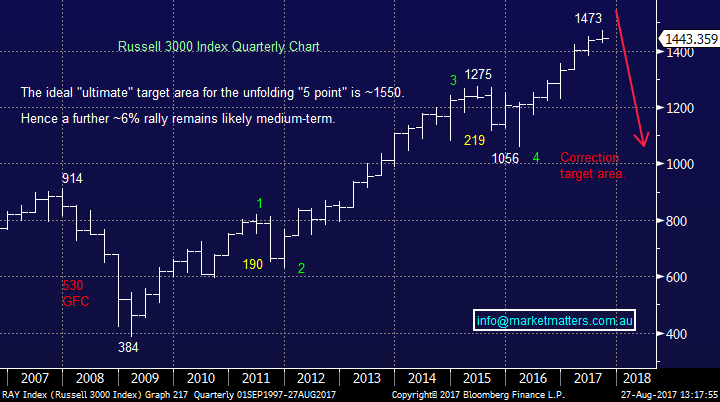
NB We have remained bullish the Russell 3000 since early 2016 but note our long-term target of ~1550 is approaching reasonably fast, hence we are being particularly careful with purchasing stocks as this 8-year bull market reaches maturity – and often buying stocks into weakness, rather than strength.
US Russell 3000 Quarterly Chart
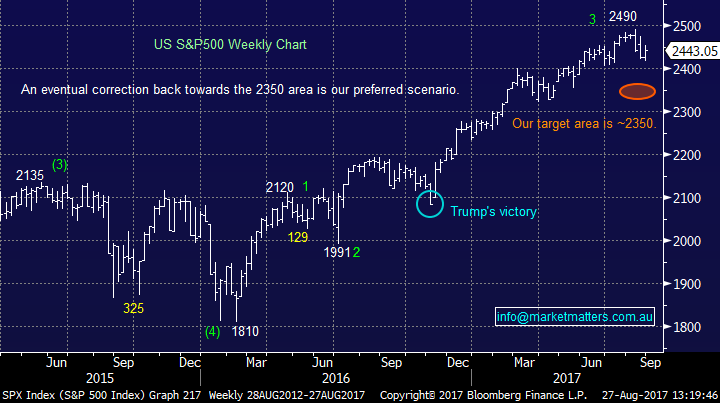
Medium-term the US stock market has played along with our forecast (s) for the vast majority of 2016/7, if this continues the recent pullback looks to have further to play out. Last week the US S&P500 bounced after making a fresh 6-week low but we are still targeting ~2350 for the coming weeks i.e. ~4% lower.
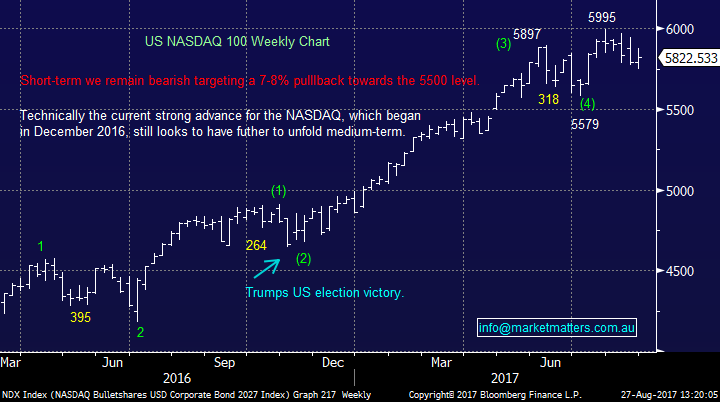
The tech NASDAQ chart continues to remain the clearest pattern to us presently and we’re targeting ~5575 for this volatile index i.e. 4.2% lower. Importantly the NASDAQ is correcting in an orderly fashion as opposed to a sharp pullback. This makes us more confident in buying this ~7% retracement assuming it unfolds but less optimistic than a sharp panic style spike lower will present some standout bargains.
US S&P500 Weekly Chart
US NASDAQ Weekly Chart
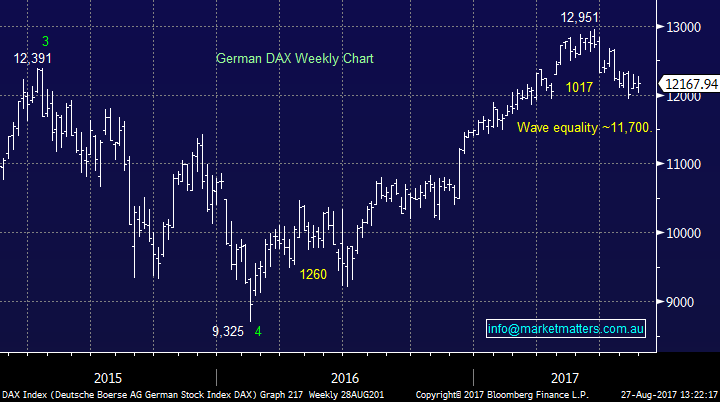
No real change for European stocks which have been in correction mode since May, the German Dax currently sits 6.1% below its 2017 high. We are only targeting ~11,700 before we would be looking for “backfoot” buying opportunities i.e. we only see another 3.8% downside before we become neutral / bullish.
In the bigger picture we still see German stocks trading well over 13,000 before major alarm bells will ring.
German DAX Weekly Chart
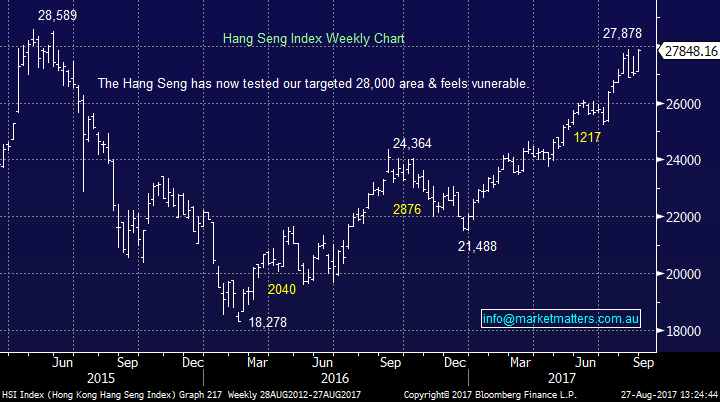
Asian Indices traded strongly last week led by the Hang Seng which made fresh highs for 2017, however we continue to see strong resistance around the 28,000 area and would prefer to sell strength as opposed to buy this breakout.
Overall It continues to feel like money will leave US stocks in 2017/8 and slowly be allocated to other global markets.
Hang Seng Weekly Chart
Clarifying our view on resources
Overall during this reporting season the miners have missed and the banks have beaten but the major resource stocks have soared due to capital management improvements e.g. paying higher dividends, paying off debt, implementing buybacks while reducing Capex. Basically when you’re hot you’re hot and that’s the resources sector at present but we advise a certain degree of caution. Investors are talking about FMG, RIO and BHP as the Telstra’s (TLS) of the future which is ironic considering how TLS shares have performed, I guess they are just thinking dividends again. These dividends will disappear rapidly if we see decent pullbacks in the likes of iron ore and copper.
Let’s take a look at BHP as the classic Australian resource stock and the reasonably correlated Emerging Markets Index:
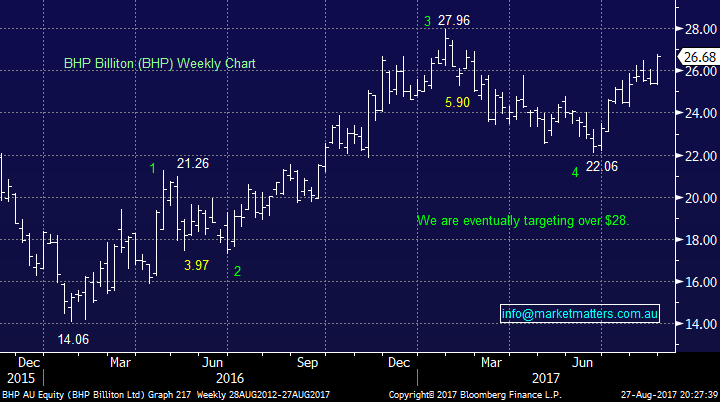
BHP has rallied 98.9% since January 2016, with a 18.7% correction in April 2016 and a 21.1% correction from January 2017 which is still unfolding – we are bullish BHP ideally targeting $28.50-$29.
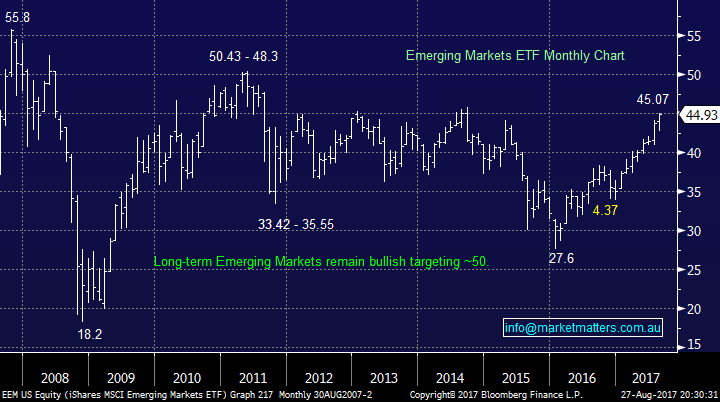
The iShares Emerging Markets ETF has rallied 63% since January 2016, with a 10.3% correction in April 2016 and an 11.4% correction from September 2016 – We remain bullish the EEM with a target around 6% higher.
The important point we are attempting to illustrate is these are volatile stocks / markets that often correct over 15% and hence we like to buy when people are selling, as we did a few months ago, and vice versa plus more importantly we don’t like chasing them for fear of missing out (FOMO).
While we are very happy with our long BHP position chasing them at current levels is not exciting from a risk / reward perspective. We are likely to only be buying resource stocks moving forward into weakness as short-term plays – see todays “Trading Opportunities”.
BHP Billiton (BHP) Weekly Chart
Emerging Markets MSCI ETF Monthly Chart
Banks and interest rates
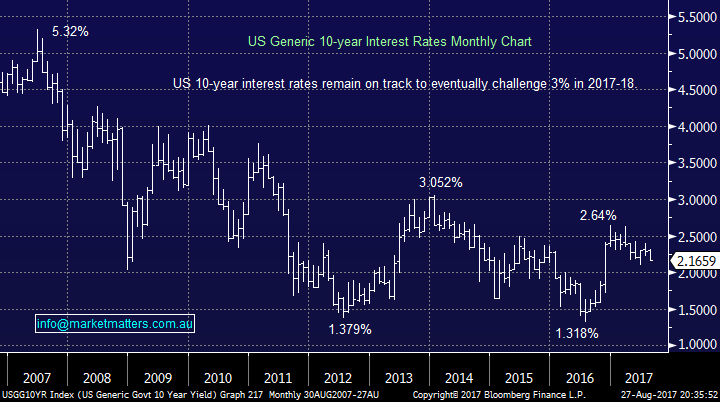
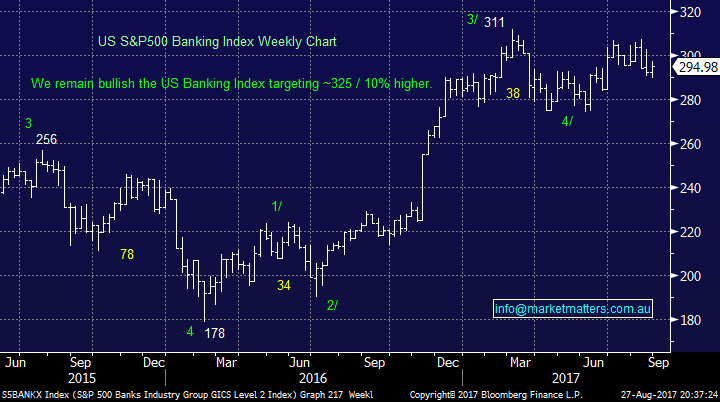
All 45 OECD countries have positive GDP growth for the first time since 2007, they just need inflation to finally raise its head and interest rates will again start to increase i.e. bonds fall. When US interest rates rise banking stocks usually catch a bid tone which certainly gives a helping hand, at the very least, to our local banks.
Our view remains that US interest rates will again start to move higher in weeks / months to come and if this proves correct banks should benefit, of course assuming the rally in rates is orderly.
Our favourite local bank to purchase at present would be BEN if its corrects under $12.
US 10-year bond interest rates Monthly Chart
US S&P500 Banking Index Weekly Chart
“Shopping List”
Below is our current shopping list of stocks plus ideal levels which has been updated from last week, unfortunately CGF and TWE have been removed as both trains looks to have left the station:
- Banks – We like the banks but our 37.5% exposure is currently enough, if we added to this position it would now likely be BEN under $12.
- Consumer Services – Aristocrat (ALL) ~$20.
- Diversified Financials – IOOF Holdings (IFL) if it corrects to around $10.80.
- Energy – No interest currently.
- Food and Beverage – No interest currently.
- Healthcare – Not a sector we currently love and now we are long HSO, that’s enough.
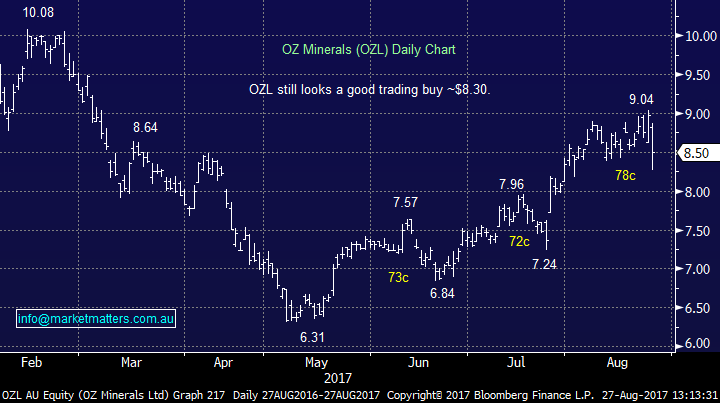
- Resources – We like OZL Minerals (OZL) as a trade ~$8.30.
- Real Estate – Another sector we are not keen on but Lend Lease (LLC) under $15.50 looks great.
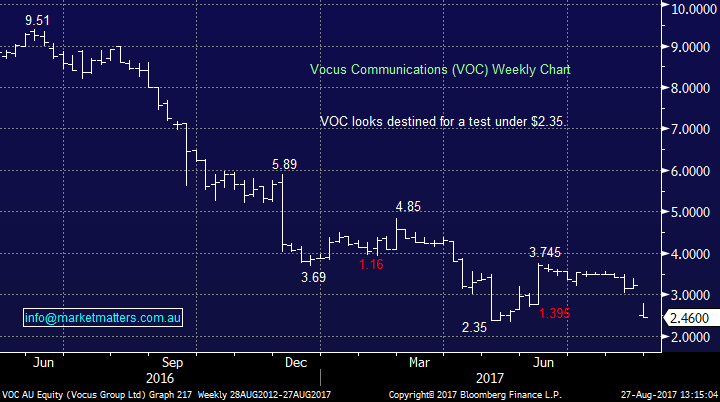
- Telco’s – aggressive traders could consider (VOC) ~$2.25
- Leisure – No interest currently.
- Retail – We still like Harvey Norman (HVN) under $4.20.
Standout technical chart (s) of the week
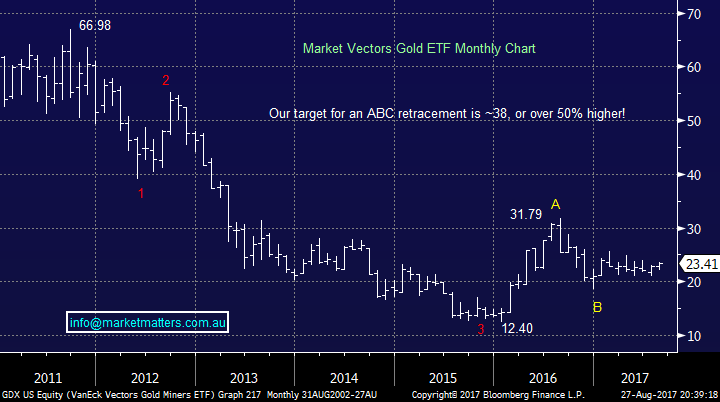
The lack of activity from gold ETF’s over the last 6-months makes the ASX200 look positively exciting over recent times. Australian gold stocks have performed ok but it’s the ETF’s the produce the big swings in our gold sector and they have been basically dormant since Q1 2017.
We remain bullish gold stocks moving forward but we need some excitement from the ETF’s to get truly inspired – watch this space.
Market Vectors Gold ETF Monthly Chart
Investing opportunities for the coming week(s)
Refer to the “shopping list” earlier in the report.
Ideally we are looking to allocate a decent portion of our 11% cash position into the market ~5500 basis the ASX200 but this is feeling less likely by the week, hence we are happy to have put some $$ to work over recent times.
ASX200 Monthly Chart
Trading Opportunities on our radar
Yet again have 2 trading situations on our radar and although ones a bit scary but we like it technically:
- OZ Minerals (OZL) – OZL looks a great buy ~$8.30, we would be concerned under $7.90.
- Vocus Communications (VOC) – VOC looks a good technically driven “high risk” trade ~$2.25, but stops are hard to assess hence we advocate a relatively small position.
OZ Minerals (OZL) Daily Chart
Vocus Communications (VOC) Weekly Chart
Summary
We are short-term bearish the ASX200 ideally targeting a correction back towards the 5500 support area, however we are aware that the local market is demonstrating excellent resilience into any weakness leading to a slightly reduced conviction with this view.
Overnight Market Matters Wrap
· The US closed mixed with marginal change, but a positive bias as comments from US Fed Chair Yellen had little mention in the Jackson Hole meet.
· The European Central Bank president had also indicated a similar factor that "a significant degree of accommodation" was still required.
· Domestic corporate earnings today are ADH, ALI, IFM, JHC, LLC & PRU.
· The September SPI Futures is indicating the ASX 200 to open 6 points higher, testing the 5750 level this morning.
Our Holdings
Our positions as of Friday. All past activity can also be viewed on the website through this link

Weekend Chart Pack
The weekend report includes a vast number of charts covering both domestic and international markets, including stock, indices, interest rates, currencies, sectors and more. This is the engine room of our weekend analysis. We encourage subscribers to utilise this resource which is available by clicking below.

Disclosure
Market Matters may hold stocks mentioned in this report. Subscribers can view a full list of holdings on the website by clicking here. Positions are updated each Friday.
Disclaimer
All figures contained from sources believed to be accurate. Market Matters does not make any representation of warranty as to the accuracy of the figures and disclaims any liability resulting from any inaccuracy. Prices as at 28/08/2017. 9.00PM.
Reports and other documents published on this website and email (‘Reports’) are authored by Market Matters and the reports represent the views of Market Matters. The MarketMatters Report is based on technical analysis of companies, commodities and the market in general. Technical analysis focuses on interpreting charts and other data to determine what the market sentiment about a particular financial product is, or will be. Unlike fundamental analysis, it does not involve a detailed review of the company’s financial position.
The Reports contain general, as opposed to personal, advice. That means they are prepared for multiple distributions without consideration of your investment objectives, financial situation and needs (‘Personal Circumstances’). Accordingly, any advice given is not a recommendation that a particular course of action is suitable for you and the advice is therefore not to be acted on as investment advice. You must assess whether or not any advice is appropriate for your Personal Circumstances before making any investment decisions. You can either make this assessment yourself, or if you require a personal recommendation, you can seek the assistance of a financial advisor. Market Matters or its author(s) accepts no responsibility for any losses or damages resulting from decisions made from or because of information within this publication. Investing and trading in financial products are always risky, so you should do your own research before buying or selling a financial product.
The Reports are published by Market Matters in good faith based on the facts known to it at the time of their preparation and do not purport to contain all relevant information with respect to the financial products to which they relate. Although the Reports are based on information obtained from sources believed to be reliable, Market Matters does not make any representation or warranty that they are accurate, complete or up to date and Market Matters accepts no obligation to correct or update the information or opinions in the Reports.
If you rely on a Report, you do so at your own risk. Any projections are estimates only and may not be realised in the future. Except to the extent that liability under any law cannot be excluded, Market Matters disclaims liability for all loss or damage arising as a result of any opinion, advice, recommendation, representation or information expressly or impliedly published in or in relation to this report notwithstanding any error or omission including negligence.
To unsubscribe. Click Here