Subscriber Questions (MQG, RRL, STO, MVF, HSO, WBC, NAB, BHP, SUN, BKL, BAL)
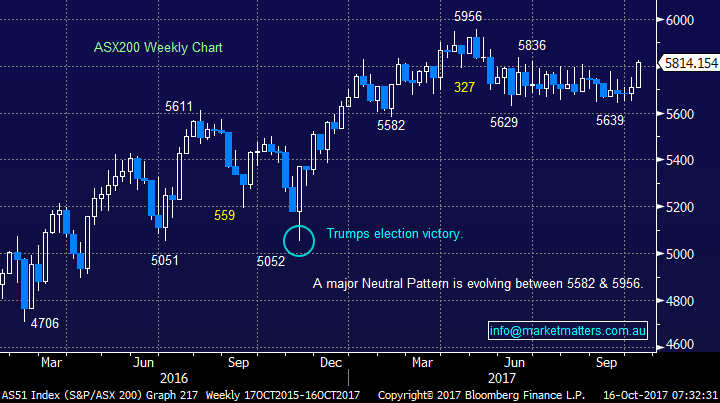
This morning we are entering the 22nd week of the ASX200 range trading between 5629 and 5836, following last week’s strong upside momentum the market feels likely to at least pop to the upside, whether it has the strength to push beyond 5850 remains the big question. On balance we believe it’s unlikely for now when we consider the position of global equities but last week we clearly witnessed local stocks demonstrating they are very capable of running their own race, at least for a while, plus we are now in a historically strong time for local stocks with some attractive major dividends on the horizon in November – hence the remain open-minded song keeps playing.
For now at least MM is comfortable sitting on 14% cash in the MM Growth Portfolio as we anticipate further “tweaking” of our exposures into Christmas. This week we currently have 1 buying and 2 selling opportunities which we are watching closely but of course the market often throws a curve ball so these may easily evolve as the days pass:
Buys – Begin accumulating Macquarie Group (MQG) under $92.
Sells – Regis Resources (RRL) over $4 and Santos (STO) around $4.40.
ASX200 Weekly Chart
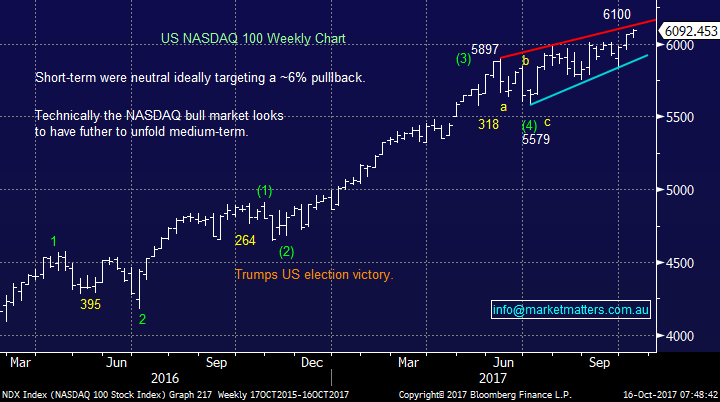
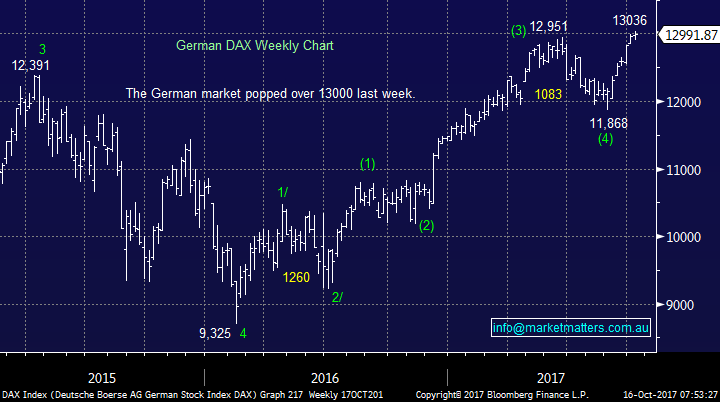
Interestingly in comparison if we were investing in US or German stocks we currently would be increasing cash levels in anticipation of a correction.
US NASDAQ Weekly Chart
German DAX Weekly Chart
Question 1
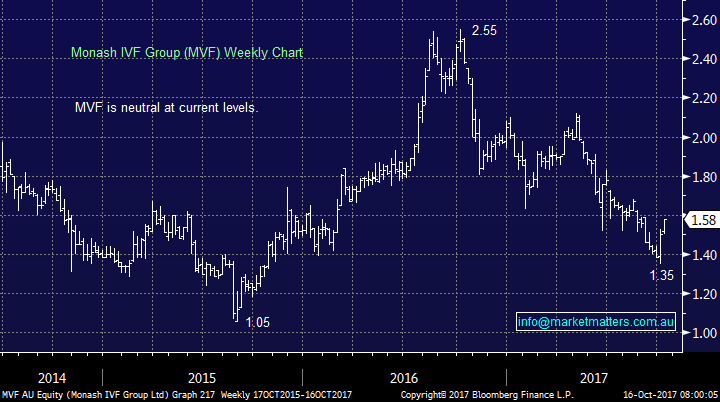
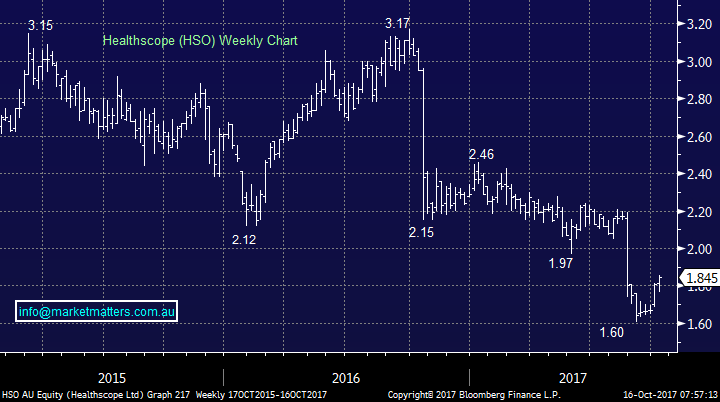
“Hi MM, I'm interested in your technical views and possible sell targets on both Monash (MVF) - previously on your radar and Healthscope (HSO) with the recent uplift.” - Cheers, Nath.
Morning Nath, thanks for taking us back to the frustrating HSO! Seriously though thanks for your question which illustrates the broad strength within the Australian market over recent weeks. Unfortunately we are unable to give you the most definitive answer (s) to the questions:
1. MVF looks very 50-50 at current levels, if we were long technically it would be tempting to give it room and run stops under $1.42.
2. HSO has now rallied ~25c, very similar to what it did in June. If we were long we would be selling at least half of our position here. On the buy side we would currently be looking to the distant $1.50 area before becoming keen.
Monash IVF (MVF) Weekly Chart
Healthscope (HSO) Weekly Chart
Question 2
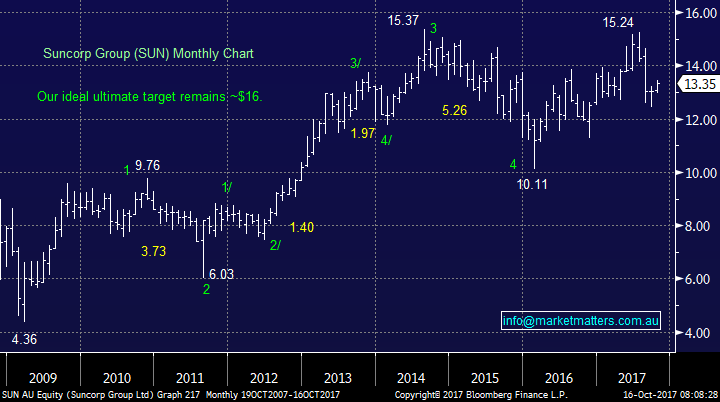
“In the growth portfolio the Suncorp entry price is $13.41 and the last price is $13.35. How is the gain/loss of 14.54% arrived at?” – Frank F.
Morning Frank, thanks for a great question that may have crossed the mind of a number of subscribers. Three points on our SUN holding worth pointing out at this stage:
- We have been long SUN since October 2015, worth noting for investors who find us too active at times i.e. 2 years.
- During this period we have collected $2.01 in fully franked dividends – SUN currently yields ~5.5% fully franked / 7.81% grossed up.
- Hence when you include the dividends our position is showing a 14.54% paper profit.
Suncorp (SUN) Monthly Chart
Question 3
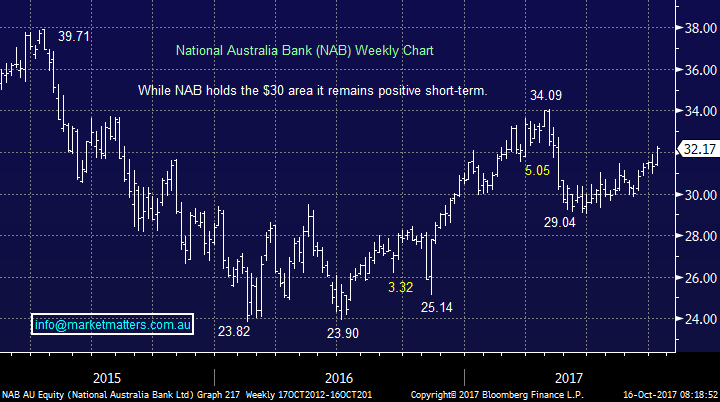
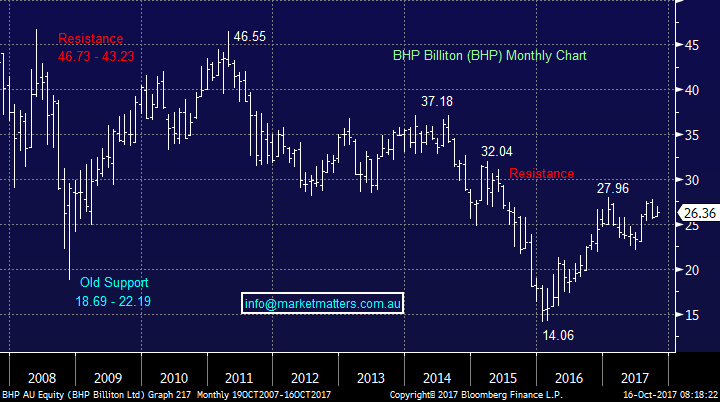
“Hi MM, For my grandson's 21st Birthday I would like to give him shares to the value of $5000. As a long term investment, what would you recommend? My initial thoughts would be either NAB or BHP or a combination of both.” – John S.
Morning John, a good question and one I’ve had some experience within. Below my thoughts on those two stocks + what I have done for my kids.
- NAB – the banking sector looks well positioned moving forward if our population continues to grow and they continue to invest in IT, similar to the European banks mentioned in the Weekend Report. Plus reinvesting the dividends will grow the holding.
- BHP – BHP has had an awful decade but as we are believers in the reflation trade it may have a better one ahead. For the first time in many years this now makes sense plus again reinvesting the dividends will grow the holding.
I’ve done something a little different and simply bought 2 Exchange Traded Funds. The STW which tracks the ASX 200 and the IVV which tracks the S&P 500. Initial investment was 5k each (I have 2 kids), reinvesting the dividends and adding to them on each birthday. Why did I do this over and above 2 stocks? Simplicity is the main reason however instant diversification is the other. As you know, I’m not really a buy and hold investor however in this instance I am, and in that case having diversification and adding to the holdings regularly makes sense to me.
National Australia Bank (NAB) Weekly Chart
BHP Billiton (BHP) Monthly Chart
Question 4
“Good morning. Thank you for your continuing very helpful advice. If I purchase shares before the dividend is declared (but less than 45 days) can I benefit from the franked taxation benefit if I hold them until such time the 45 day has expired (although that will be after the ex-dividend date). I am thinking of purchasing more shares now in banks to gain from November dates but then wish to hold them for the longer term as an investment. Two-bob each way!” - Many thanks Brian.
Morning Brian, the first answer is yes, however you need to hold them for 45-days in total, however in practice it really should be the 47 day rule as it does not include the day or purchase or the day of sale. That said, there is a carve out for small investors where the franking credits being claimed on an annual basis are less than $5,000 the holding period does not apply. There are a few other conditions that also need consideration, such as the ‘At Risk’ test which is relevant if you hedge positions using options, CFDs or the like. It’s always prudent to confirm with your accountant first as we do not provide tax advice.
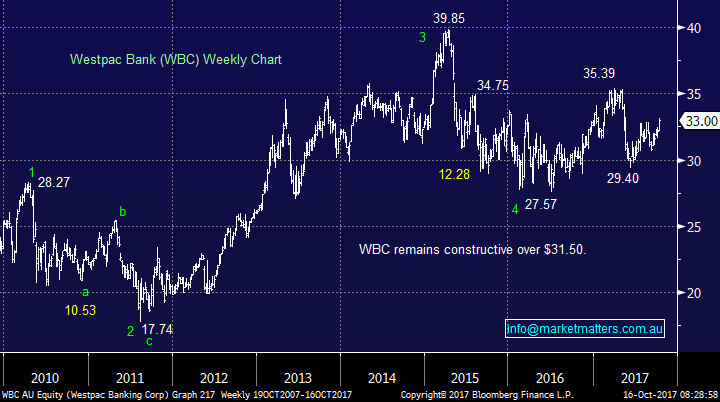
As MM has been pointing out if you buy Westpac (WBC) for example today you will receive a healthy 3 dividends over the next 13-months, likely to be around $2.85 fully franked.
Westpac (WBC) Weekly Chart
Question 5
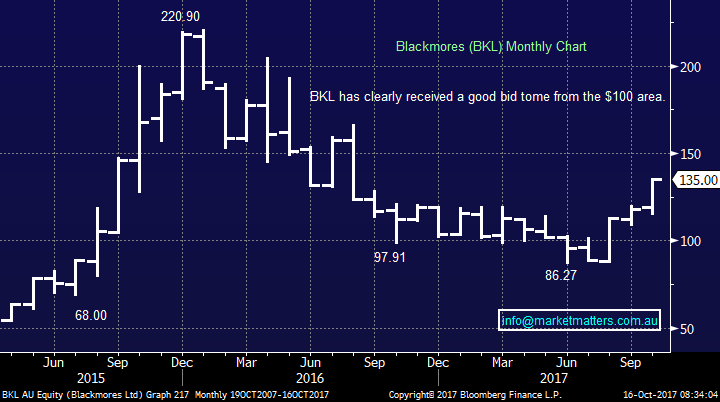
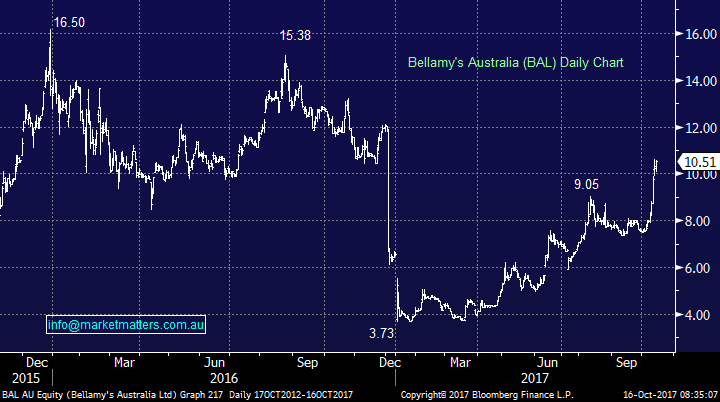
“Hi Team, Just like to know your thoughts on the current rally for Blackmores (BKL).” - Thanks, Peter
Morning Peter, we always felt the likes of BKL and BAL would bounce hard, it was more a question of when. If they had remained depressed prior to the classic “Christmas rally” period we may have taken a trade in one of them looking a strong bounce similar to what is currently unfolding.
The current rally again ties in with the theme discussed in the Weekend Report where fund managers look to have been scrambling for some market exposure with a specific eye on the underperformers / perceived cheap parts of the market.
In our opinion the horse has unfortunately bolted and from a risk / reward perspective we could not be chasing at these levels.
Blackmores (BKL) Monthly Chart
Bellamy’s (BAL) Daily Chart
Overnight Market Matters Wrap
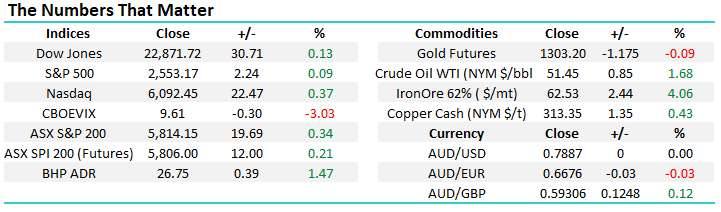
· The SPI is up 12 points as the DJIA and S&P 500 rallied circa 0.1%, while the NASDAQ closed 0.22% in the black.
· US financial stocks continue to trade lower after third quarter earnings. On Friday, Wells Fargo fell nearly 3% as the bank reported weaker than anticipated revenue.
· US Fed Chair Yellen said that recent soft inflation readings will not persist. Strong labour markets will likely prices move higher next year. ECB President Draghi is confident of meeting its inflation goal.
· Nickel was stronger but other metals on the LME were slightly weaker. Oil and gold were better, while iron ore put on 4%.
Disclosure
Market Matters may hold stocks mentioned in this report. Subscribers can view a full list of holdings on the website by clicking here. Positions are updated each Friday.
Disclaimer
All figures contained from sources believed to be accurate. Market Matters does not make any representation of warranty as to the accuracy of the figures and disclaims any liability resulting from any inaccuracy. Prices as at 16/10/2017. 8.00AM.
Reports and other documents published on this website and email (‘Reports’) are authored by Market Matters and the reports represent the views of Market Matters. The MarketMatters Report is based on technical analysis of companies, commodities and the market in general. Technical analysis focuses on interpreting charts and other data to determine what the market sentiment about a particular financial product is, or will be. Unlike fundamental analysis, it does not involve a detailed review of the company’s financial position.
The Reports contain general, as opposed to personal, advice. That means they are prepared for multiple distributions without consideration of your investment objectives, financial situation and needs (‘Personal Circumstances’). Accordingly, any advice given is not a recommendation that a particular course of action is suitable for you and the advice is therefore not to be acted on as investment advice. You must assess whether or not any advice is appropriate for your Personal Circumstances before making any investment decisions. You can either make this assessment yourself, or if you require a personal recommendation, you can seek the assistance of a financial advisor. Market Matters or its author(s) accepts no responsibility for any losses or damages resulting from decisions made from or because of information within this publication. Investing and trading in financial products are always risky, so you should do your own research before buying or selling a financial product.
The Reports are published by Market Matters in good faith based on the facts known to it at the time of their preparation and do not purport to contain all relevant information with respect to the financial products to which they relate. Although the Reports are based on information obtained from sources believed to be reliable, Market Matters does not make any representation or warranty that they are accurate, complete or up to date and Market Matters accepts no obligation to correct or update the information or opinions in the Reports.
If you rely on a Report, you do so at your own risk. Any projections are estimates only and may not be realised in the future. Except to the extent that liability under any law cannot be excluded, Market Matters disclaims liability for all loss or damage arising as a result of any opinion, advice, recommendation, representation or information expressly or impliedly published in or in relation to this report notwithstanding any error or omission including negligence.
To unsubscribe. Click Here