Australian gold stocks are rallying as gold struggles? (RRL, NCM, IFL, CBA)
The ASX200 continues to run its own race ignoring influences from individual stocks / sectors as fund managers continue to buy any weakness. Yesterday we were down 22-points at lunchtime with ANZ in particular weighing on the market but buying again remerged and we finally closed the day up 10-points, totally ignoring the 112-point decline by the Dow.
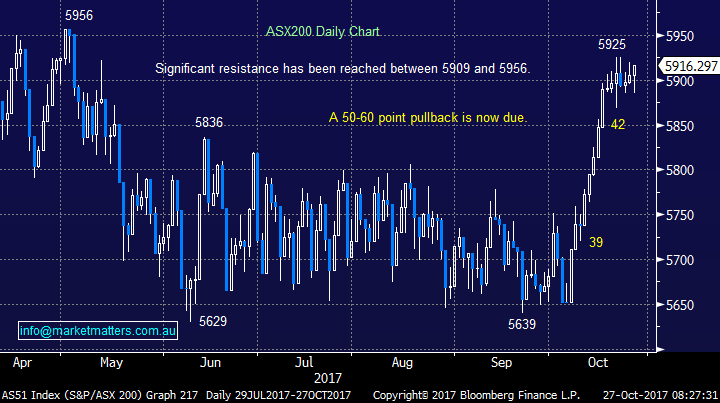
We still remain bullish the ASX200 targeting a clear break over the psychological 6000 barrier which has capped the market since March 2015 – at this point in time it feels like the only question is when. We would need the market to break back under 5800 for us to lose this positive outlook.
The MM Growth Portfolio remains in 15% cash but a few opportunities are close at hand.
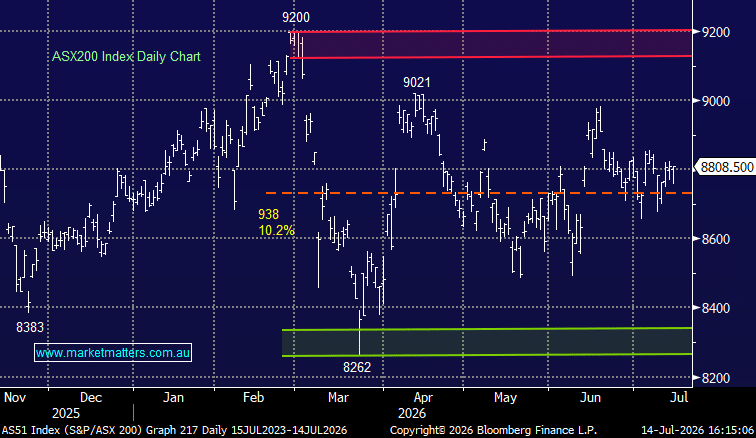
ASX200 Daily Chart
Local gold stocks
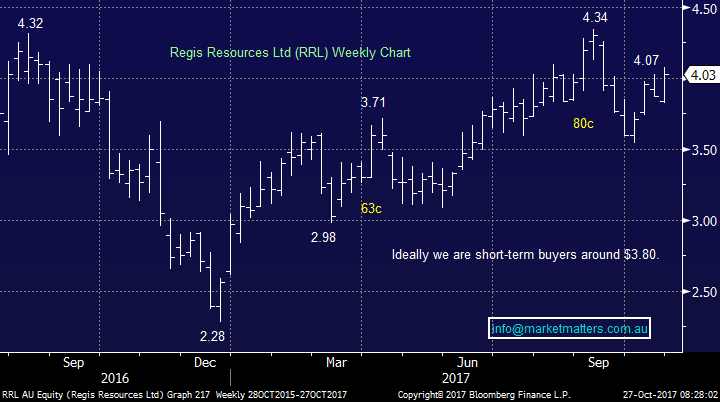
Since early October gold has struggled and following last nights $US11/oz. fall the precious metal is very close to making fresh lows since August, yet stocks like our “old favourite” Regis Resources (RRL) made 6-week highs yesterday.
Regis Resources (RRL) Weekly Chart
The simple answer is again found in the currency arena which is playing many tunes in today’s market. The $US has an enormous influence on the underlying gold price which is priced in $US but not necessarily our gold stocks which also have to contend with the vagaries of the $A.
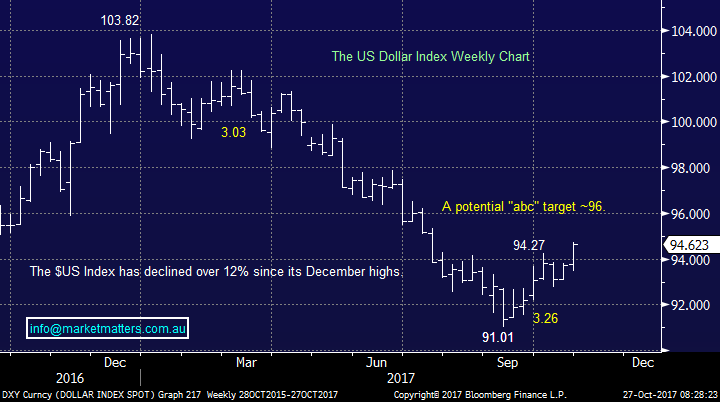
1. A weak $US is bullish gold as its priced in $US e.g. while the $US Index declined 12% in 2017 gold rallied ~$US200/oz.
2. While the $US has bounced 4% since early September gold has fallen ~$US80/oz.
Our underlying view remains the $US should bounce another ~1.5% before resuming its downtrend of 2017, so if we are correct gold should be relatively close to again turning higher.
The $US Index Weekly Chart
Hence, we are ideally looking to increase our gold exposure into short-term sector weakness but this has not materialised as hoped. The reason being the $A which has fallen hard recently given the widening gap between local interest rate expectations and those in the US which are expected to rise. i.e. a widening interest rate differential.
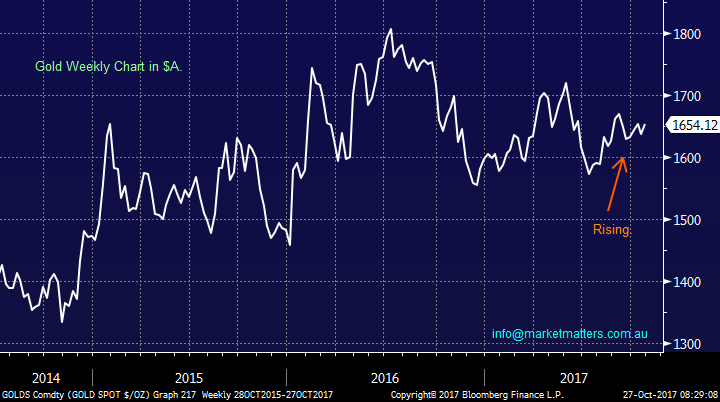
In $A, gold has actually risen steadily since the start of this financial year. Subsequently the weakness we were anticipating / hoping for the local gold sector since we took profit on our short-term play in RRL has not materialised.
Gold in $A Weekly Chart
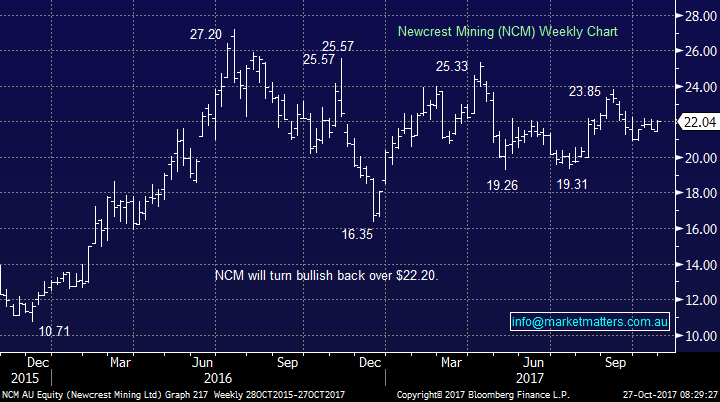
Local heavyweight Newcrest which we own actually looks poised to break out to the upside.
Newcrest Mining (NCM) Weekly Chart
Therefore MM has rejigged its view on gold and more importantly the local gold stocks:
1. We are keen to re-establish our short-term position in RRL but are now buyers ~$3.80.
2. We will not chase the stock because we already have sector exposure via NCM.
3. Furthermore, we are in the market trying to buy Oz Minerals (OZL) under $8.25, a company that also has some gold correlation (but is primarily Copper)
A Portfolio buy & sell we are considering.
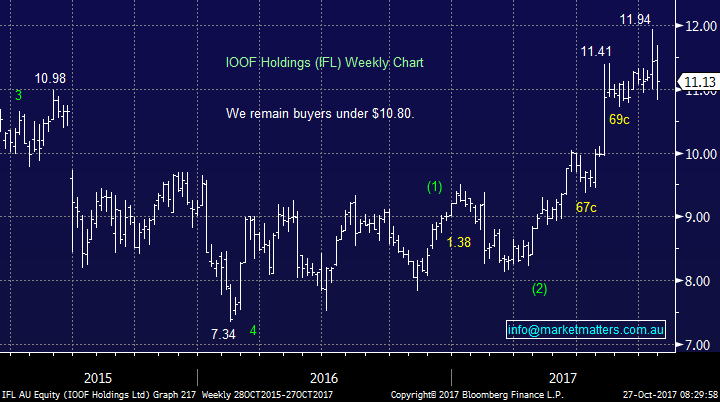
1 Buy IOOF Holdings (IFL) $11.13
We have been monitoring IFL for the last few months with an optimum buy target area under $10.80 – typical for us of late the stock hit $10.82 yesterday but there was no real opportunity to buy much stock sub $10.90.
IOOF has recently purchased ANZ’s wealth management business for just under $1bn, funding part of the acquisition with an institutional share placement at $10.60 to raise $461m. We like the deal for IFL but see no reason at this stage to pay above a ~2% premium to the institutional placement, hopefully we are not being too fussy.
MM is buyers of IFL around $10.80.
IOOF Holdings (IFL) Weekly Chart
2 Sell / switch a bank – excuse the looseness
MM currently has 32.5% of Platinum Portfolio in banks plus 12% in the correlated Suncorp i.e. a large holding considering our banks, not including Macquarie make up 25.9% of the ASX200. We are approaching a fascinating time for the banks who have enjoyed a great rally since early September. What’s on our mind?
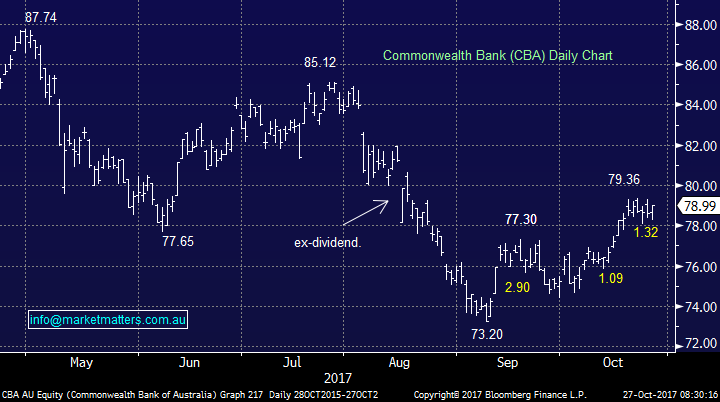
1. CBA looks set to test ~$81 but we would be sellers of the sector around these levels anticipating a classic November correction.
2. CBA does not go ex-dividend until February whereas the other banks except Bendigo (BEN) go ex-div.in November.
3. Over the last month CBA has rallied 5.2% compared to only 0.9% from ANZ.
4. Since the GFC CBA has corrected on average 6% in November at one stage – we obviously have used CBA because it does not trade ex-dividend next month.
Commonwealth Bank (CBA) Daily Chart
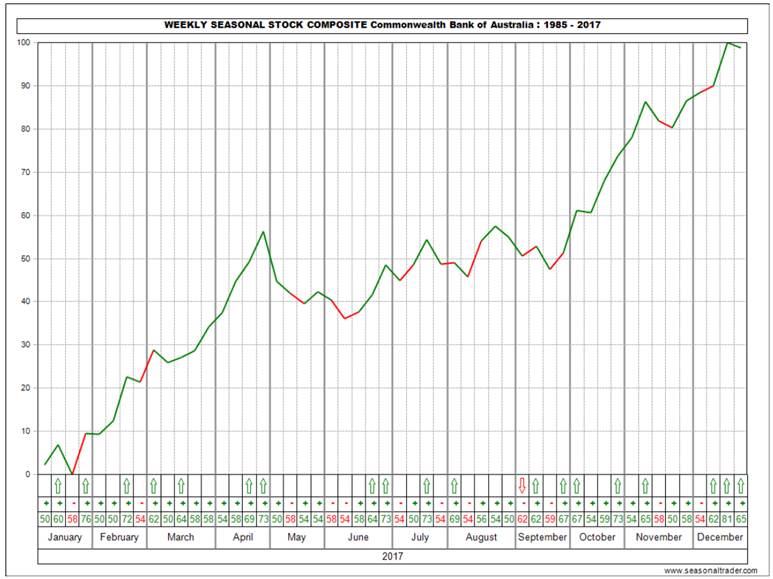
The statistics are amazingly clear for CBA in November, with very little deviation, especially since the GFC when the market, including CBA has been rallying.
1. CBA’s average pullback at one stage in November over the last 8-years is 6.1%.
2. The smallest correction was 3.2% but in 2009 and 2011 the pullback was over 10%.
3. On average if you sell around the 12-14th and buy back around the 22nd you’ve added solid value to your portfolio.
This clearly throws up the opportunity for switching between banks in November, especially with succulent dividends on offer – watch this space!
Commonwealth Bank (CBA) Daily Seasonality Chart
Global Indices
US Stocks
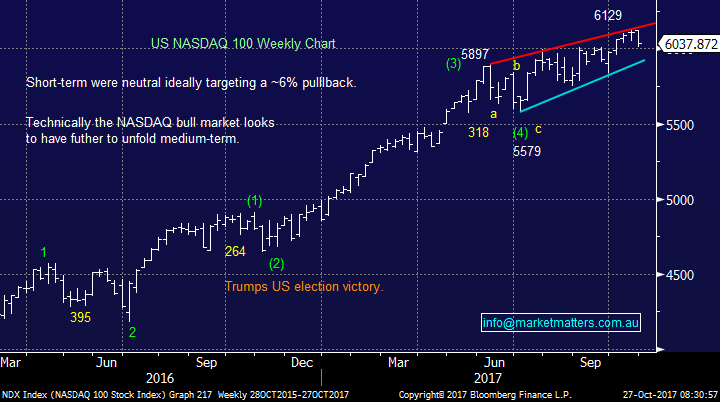
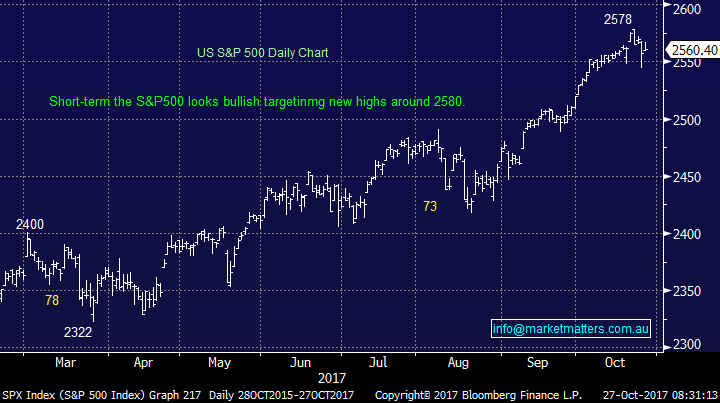
US equities were again higher last night, which is a phrase we feel that we’ve typed repeatedly of late. However the NASDAQ which we believe is the leading index fell -0.3%, while short-term the S&P looks well positioned for one more high, only an advance of ~1%, we believe this index is “looking for a top” .
Overall there is no change to our short-term outlook for US stocks, where we would advocate patience ideally targeting a ~5% correction for the broad market to provide a decent risk / reward buying opportunity.
US NASDAQ Weekly Chart
US S&P500 Daily Chart
Conclusion (s)
No major change, remain flexible and be prepared to “tweak” portfolios when appropriate and this may well become one of the most exciting periods from investing we’ve ever witnessed.
We have now adjusted our active view on local gold stocks and are buyers of RRL ~$3.80.
Overnight Market Matters Wrap
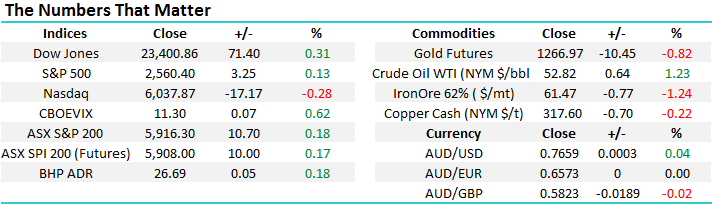
· Strong earnings numbers overnight from key US stocks saw Wall St shake off the previous day’s losses and rebound back towards recent highs, with the Dow skirting again in record territory intra-day, before settling at just above 23400.
· Better than expected 3rd qtr earnings from the likes of Ford, DowDupont, American Express and Nike buoyed optimism about the continuing underlying strength of the US economy.
· The December SPI Futures is indicating the ASX 200 to open 15 points higher this morning, towards the 5930 area.
Disclosure
Market Matters may hold stocks mentioned in this report. Subscribers can view a full list of holdings on the website by clicking here. Positions are updated each Friday, or after the session when positions are traded.
Disclaimer
All figures contained from sources believed to be accurate. Market Matters does not make any representation of warranty as to the accuracy of the figures and disclaims any liability resulting from any inaccuracy. Prices as at 27/10/2017. 8.00AM.
Reports and other documents published on this website and email (‘Reports’) are authored by Market Matters and the reports represent the views of Market Matters. The MarketMatters Report is based on technical analysis of companies, commodities and the market in general. Technical analysis focuses on interpreting charts and other data to determine what the market sentiment about a particular financial product is, or will be. Unlike fundamental analysis, it does not involve a detailed review of the company’s financial position.
The Reports contain general, as opposed to personal, advice. That means they are prepared for multiple distributions without consideration of your investment objectives, financial situation and needs (‘Personal Circumstances’). Accordingly, any advice given is not a recommendation that a particular course of action is suitable for you and the advice is therefore not to be acted on as investment advice. You must assess whether or not any advice is appropriate for your Personal Circumstances before making any investment decisions. You can either make this assessment yourself, or if you require a personal recommendation, you can seek the assistance of a financial advisor. Market Matters or its author(s) accepts no responsibility for any losses or damages resulting from decisions made from or because of information within this publication. Investing and trading in financial products are always risky, so you should do your own research before buying or selling a financial product.
The Reports are published by Market Matters in good faith based on the facts known to it at the time of their preparation and do not purport to contain all relevant information with respect to the financial products to which they relate. Although the Reports are based on information obtained from sources believed to be reliable, Market Matters does not make any representation or warranty that they are accurate, complete or up to date and Market Matters accepts no obligation to correct or update the information or opinions in the Reports.
If you rely on a Report, you do so at your own risk. Any projections are estimates only and may not be realised in the future. Except to the extent that liability under any law cannot be excluded, Market Matters disclaims liability for all loss or damage arising as a result of any opinion, advice, recommendation, representation or information expressly or impliedly published in or in relation to this report notwithstanding any error or omission including negligence.
To unsubscribe. Click Here