What does November usually deliver? (CYB, NAB, TLS)
The local market has started November strongly and is looking poised to trade over 5950 this morning, as pundits continue to talk correction (s). This morning we are looking closely at the month before Christmas as opportunities continue to present themselves – importantly we have delved deeply into this historically volatile month of November as opposed to just crunching some simple numbers on our computer which produce some pretty useless “averages” but certainly no roadmap.
Also, later in the report we have focused on 3 stocks that had a tough time yesterday in a market where “buy the dip” has been the successful battle cry since Donald Trump became US President.
Following Octobers 4% surge we remain bullish the local market, especially with the resources sector regaining its mojo and more than offsetting the recent weakness within our banks.
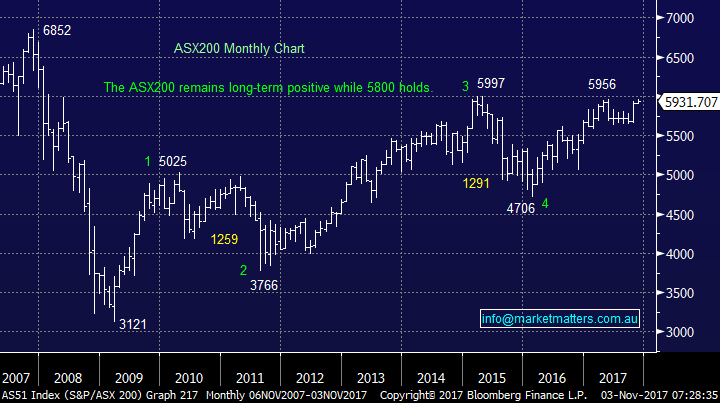
- We remain bullish the ASX200 into 2018 targeting a solid break over 6000.
- We would need a break back under 5800 to lose this short-term bullish outlook.
ASX200 Monthly Chart
What does November usually deliver?
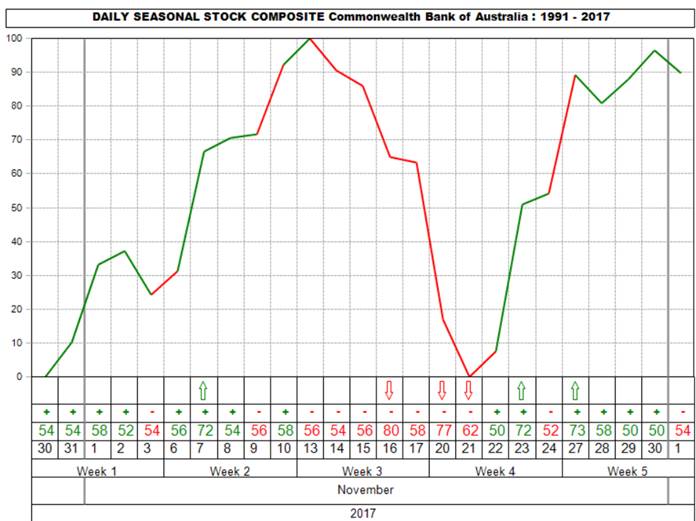
We’ve discussed in the past CBA’s average pullback at one stage in November of over 6% since the GFC, certainly very meaningful considering it does not trade ex-dividend in November unlike Bank of Queensland (46c fully franked yesterday), ANZ, NAB and Westpac (WBC). This degree of pullback is also very significant when we consider that CBA has rallied over +220% since the GFC, before we include its huge dividends.
So, we know CBA and the banks have experienced a tough / volatile November since the GFC but what about the ASX200 itself? The numbers are both compelling and consistent:
- At some point in November the ASX200 corrects on average a whopping -5.3%.
- While the smallest correction was -2.8% and the largest was -9.0%, the most common pullback by far is between -4.1% and -5.5%.
- The correction usually lasts ~11days.
- The most common period for the correction is between the 10th and 20th of the month.
- Half of the time we get a relatively minor pullback early in the month, before another attempt to rally which pre-empts the meaningful pullback.
- Not surprisingly, with the majority of the sector trading ex-dividend in the month, the banking sector usually underperforms the broad market in November.
Hence our 2 important / relevant conclusions:
1. Even though we are bullish the ASX200 targeting a clean break over 6000 in 2017/8 we do not want to chase the market at current levels, especially considering our cash level is now only 10% in the Growth Portfolio & a tad over 9% in the Income Portfolio.
2. However, if the market experiences a decent correction of around 4-5% / over 10-days this month we are likely to then become aggressive buyers.
CBA Seasonal Chart
Looking at 3 weak stocks from yesterday.
Today we have taken a brief look at 3 stocks who had large moves yesterday, again importantly stating our view and potential action if appropriate.
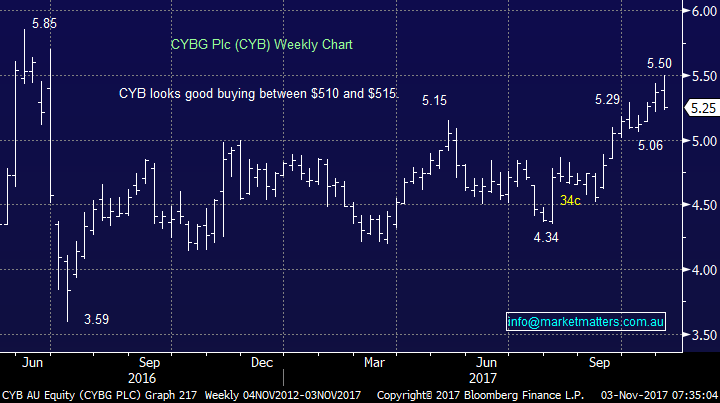
1 CYB Plc (CYB) $5.25
CYB tumbled -4.2% yesterday following news that the UK regulator had hit them with another fine + trade was not helped by an overall poor banking sector on the day. Throw in a recent 20% rally in the stock and the Bank of England’s rate decision and unsurprisingly, we saw some clear profit taking.
Overnight, the BoE raised interest rates however the market was positioned for that so the commentary became more important. It had a district similarity to the Fed when they raised rates the first time, with Mark Carney effectively calling it ‘one and done’ – for now at least which prompted a decent fall in the pound. This is obviously negative short-term for the UK earners on our market e.g. CYB, Henderson and BTT.
At this stage we will consider buying CYB under $5.10 i.e. nicely under were we exited the stock for a nice profit recently, we may consider switching our BOQ holding depending on relative stock levels.
CYB Plc (CYB) Weekly Chart
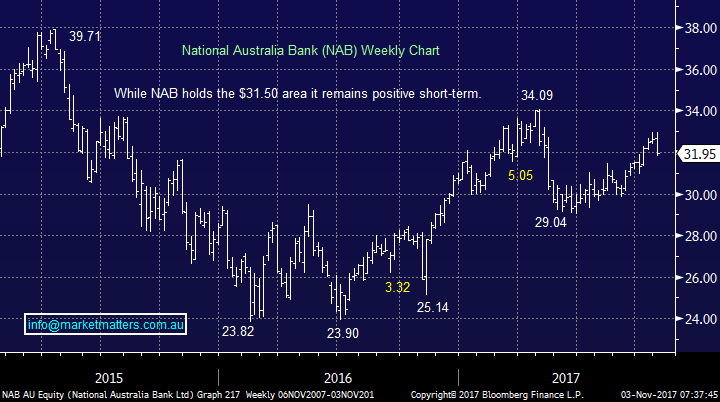
2 National Australia Bank (NAB) $31.95
Yesterday NAB fell -2.8% following another banking result which failed to excite the market. The result in itself was fine, however they detailed an aspirational cost reduction (cost to income ratio of 35% versus a sector that is normally around 42%) target but gave no time frame so the mkt seemed to disregard. In the same breath they also said that costs in FY18 would increase 5-8% in one off restructuring and technology enhancements. Overall, we felt the result was ok but if a stock has rallied into its result “ok” is often not good enough!
We remain comfortably long NAB and are enjoying its 6.2% fully franked yield – we may add an additional 2% to our Income Portfolio, although considering our cash levels of less than 10% and Novembers usual volatility patience is probably a better option.
National Australia Bank (NAB) Weekly Chart
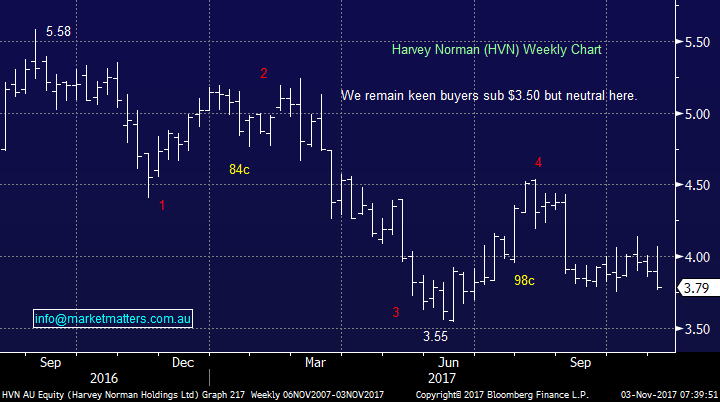
3 Harvey Norman (HVN) $3.79
HVN shares fell 5% yesterday, after soaring +5.6% on Wednesday following a positive tick by ASIC around its accounting practices.
We are comfortable with our 4% holding in the Income Portfolio which is yielding 6.86% fully franked and will consider buying for both portfolios under $3.50 if 2017’s weakness persists.
Harvey Norman (HVN) Weekly Chart
Global markets
US Stocks
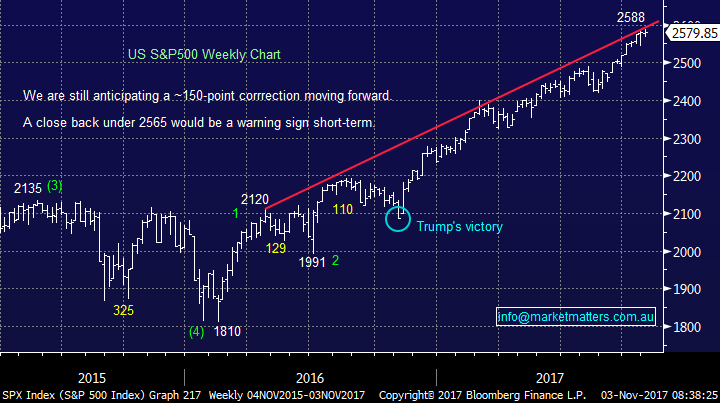
The US continues to oscillate around all-time highs and although we need a ~5% correction to provide a decent risk / reward buying opportunity, no sell signals have been generated to-date.
US S&P500 Index Weekly Chart
European Stocks
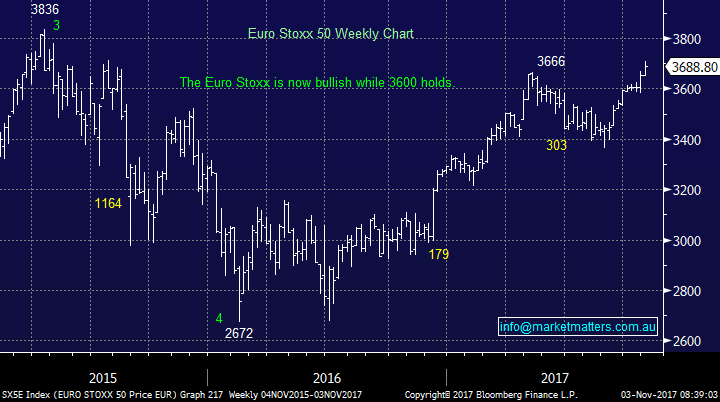
European stocks have broken out to fresh 2017 highs and are now bullish technically while the 3600 area holds i.e. ~2.7% lower.
Euro Stoxx 50 Weekly Chart
Conclusion (s)
Of the 3 stocks looked at today we will consider buying CYB under $5.10 and HVN under $3.50.
We have “tweaked” the below 4-points from yesterday:
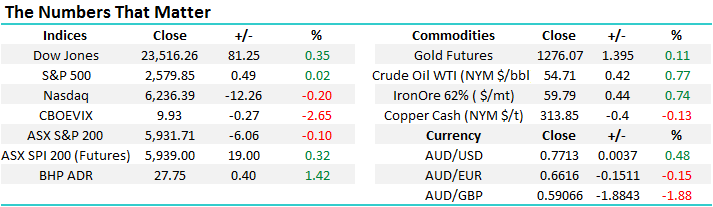
- Australian stocks with US earnings remain well positioned, especially as the $A looks very weak.
- Be selective towards the Australian consumer and interest rate sensitive stocks until further notice.
- We still believe the ASX200 will trade well over 6000 in 2017/8.
- If / when we get a ~5% correction in global equites remember the above 3 points with your decision making.
Disclosure
Market Matters may hold stocks mentioned in this report. Subscribers can view a full list of holdings on the website by clicking here. Positions are updated each Friday, or after the session where positions are traded.
Disclaimer
All figures contained from sources believed to be accurate. Market Matters does not make any representation of warranty as to the accuracy of the figures and disclaims any liability resulting from any inaccuracy. Prices as at 3/11/2017. 9.00AM
Reports and other documents published on this website and email (‘Reports’) are authored by Market Matters and the reports represent the views of Market Matters. The MarketMatters Report is based on technical analysis of companies, commodities and the market in general. Technical analysis focuses on interpreting charts and other data to determine what the market sentiment about a particular financial product is, or will be. Unlike fundamental analysis, it does not involve a detailed review of the company’s financial position.
The Reports contain general, as opposed to personal, advice. That means they are prepared for multiple distributions without consideration of your investment objectives, financial situation and needs (‘Personal Circumstances’). Accordingly, any advice given is not a recommendation that a particular course of action is suitable for you and the advice is therefore not to be acted on as investment advice. You must assess whether or not any advice is appropriate for your Personal Circumstances before making any investment decisions. You can either make this assessment yourself, or if you require a personal recommendation, you can seek the assistance of a financial advisor. Market Matters or its author(s) accepts no responsibility for any losses or damages resulting from decisions made from or because of information within this publication. Investing and trading in financial products are always risky, so you should do your own research before buying or selling a financial product.
The Reports are published by Market Matters in good faith based on the facts known to it at the time of their preparation and do not purport to contain all relevant information with respect to the financial products to which they relate. Although the Reports are based on information obtained from sources believed to be reliable, Market Matters does not make any representation or warranty that they are accurate, complete or up to date and Market Matters accepts no obligation to correct or update the information or opinions in the Reports.
If you rely on a Report, you do so at your own risk. Any projections are estimates only and may not be realised in the future. Except to the extent that liability under any law cannot be excluded, Market Matters disclaims liability for all loss or damage arising as a result of any opinion, advice, recommendation, representation or information expressly or impliedly published in or in relation to this report notwithstanding any error or omission including negligence.
To unsubscribe. Click Here