Subscriber Questions (CGC, GNC, BHP, CLX, TLS, DLC, MYX, CTI, RIO)
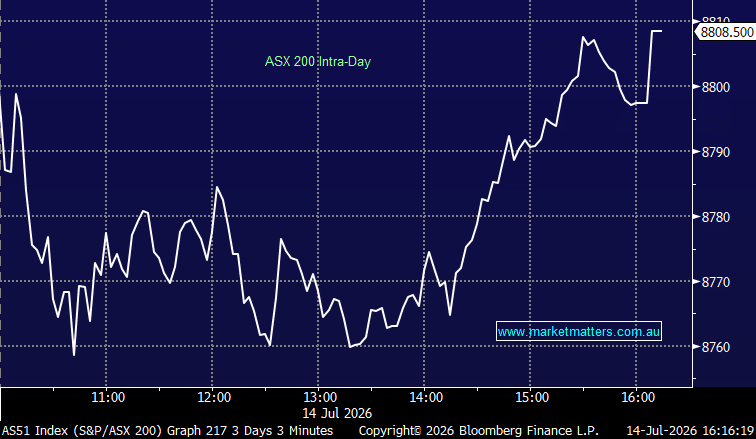
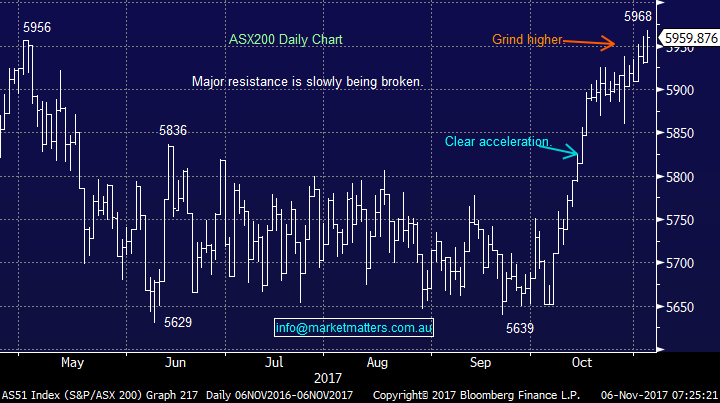
The ASX200 spent last week grinding higher as we entered the traditionally volatile and fragile November – since the GFC, we have witnessed an average correction of ~5%, with the smallest pullback still coming in at -2.8%. Seasonally, the correction manifests itself between the 10th and 20th, implying we should be on full alert at the end of this Melbourne Cup week.
We still find ourselves in a fascinating position when we balance our views on local and global markets:
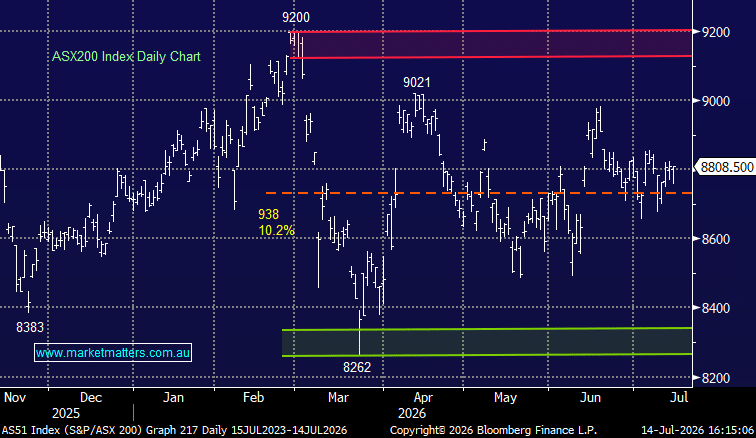
- The ASX200 looks poised to break through the long-term psychological resistance around 6000 in 2017 / 18 – we can easily see 6250-6500 in 2018.
- However, the local market is rapidly approaching the seasonally very weak window of 10-20th November e.g. CBA has corrected over 6% from this period since the GFC and it pays no dividend in the month.
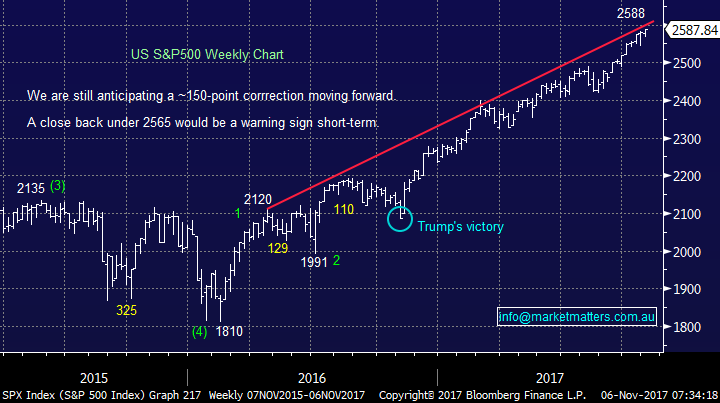
- US stocks on a risk / reward basis still look poised for ~5% correction, but still no sell signals have reared their head.
Considering we now only hold 10% cash in the MM Growth Portfolio, our next move is more likely to be a sell than a buy if the opportunity presents itself.
This week we have again received a record volume of questions which we regard as a huge compliment (at least most of them!), we’ve managed to cover 11 in this morning’s report, hence please excuse the brevity in some cases. - we are sorry if we could not get to yours, but most importantly thanks - keep them coming!
ASX200 Daily Chart
If we were specifically looking at US stocks, we would continue to increase our cash levels in anticipation of a reasonable correction.
US S&P500 Weekly Chart
Question 1
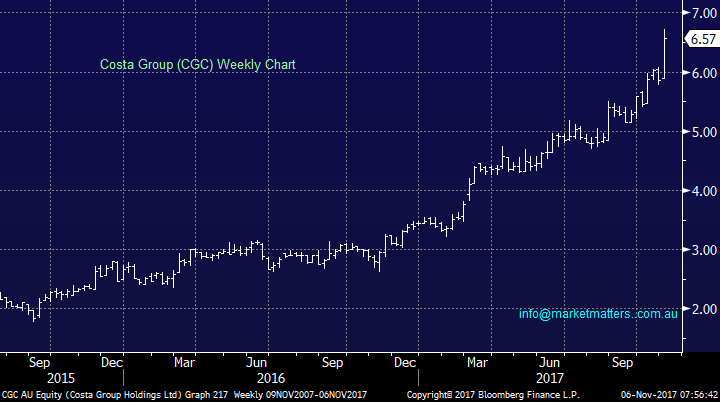
“Hi, Question for Monday. Why haven’t you guys covered or talked in detail about CGC, and amazing success story since floating and are there takeover rumours in the market ??? Why are these key Australia based agri companies out in the dark in terms of MM review versus NAN and like ????" - Cheers, Steve K.
Morning Steve, an extremely fair question which we will answer it 2 parts:
1 Costa Group Holdings Limited (CGC) floated in mid-2015 with a final listing share price at $2.25 per share, hence at the time valuing the business $850 million. This has undoubtedly been a fantastic success story which we have missed because we simply wanted to see a few more years trading since the float to get 100% comfortable with the business. We have all previously witnessed the disasters of McGrath (MEA), Myer (MYR) and Dick Smith (DSH) since they floated, hence on balance we believe there is prudent, but not fool-proof logic in our process.
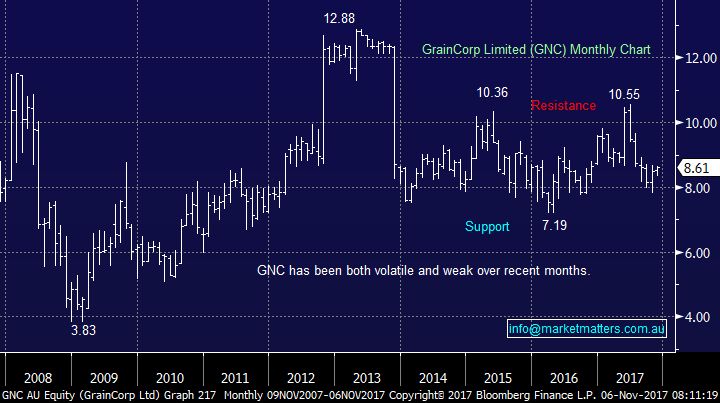
2 We do love the agri concept, but would question your reference to NAN which we feel is a solid business making a profit, although at the time we did point out it was a bit “left field for MM”. We have looked at Graincorp (GNC) in the past, but its business model has some flaws which the share price illustrates.
We will do an agri business report in the coming weeks!
Costa Group (CGC) Weekly Chart
Graincorp (GNC) Monthly Chart
Question 2
“View on BHP now that it is still rallying?” - Best Wishes, Andrew S.
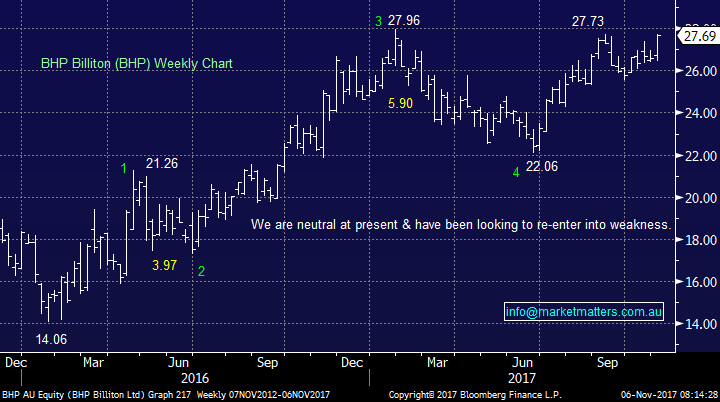
Morning Andrew, BHP has been frustrating over the last few weeks after rallying ~8% from the $25.50 region when our buy level was $25!
We remain keen to buy BHP at lower levels, but will not be chasing here, which is basically where we took profit a month ago.
BHP Billiton (BHP) Weekly Chart
Question 3
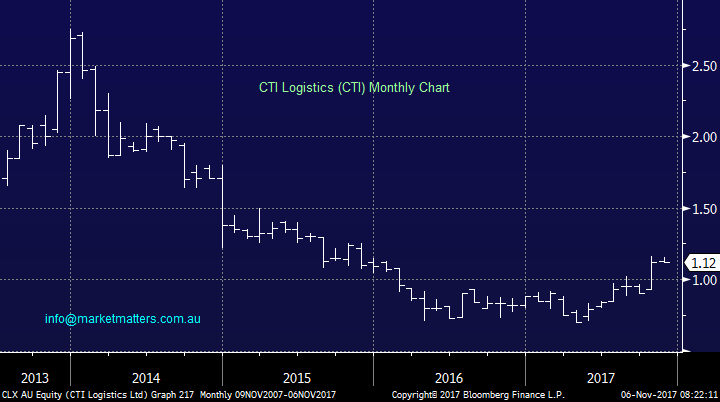
“Hi MM... I hold CTI Logistics (CLX) which have recently surged to 1.16c after a mid-year low of 0.70c. It went ex-div on 31 Oct which may explain the recent momentum, however I'm interested in your thoughts on this stock and whether you think this upswing will continue and if so how far?” - Thanks, Linda.
Morning Linda, the small dividend at the end of October should have created weakness in the stock if anything, not strength. The market has clearly embraced the acquisition of Jayde Transport, but this relatively small company is not one we watch closely – market cap of $83.3m.
Technically, we would be comfortable while the stock remains over $1, but if we were traders, after such a strong rally we would be tempted to take profit on part of our holding.
CTI Logistics (CTI) Monthly Chart
Question 4
“Hey Guys any stocks that you have been eyeing in the blockchain sector?” – Cheers Mark C.
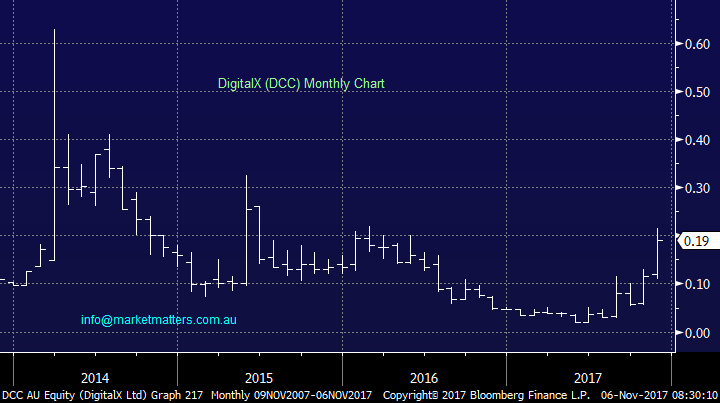
Morning Mark, arguably the most topical question around at the moment i.e. Blockchain and Bitcoin. The volatility and value in the space is hard to quantify but undoubtedly there hot at the moment. E.g. DigitalX (DCC) has soared after announcing a $4.35m investment by private company Blockchain Global Ltd.
We have nothing specifically on the radar at present, but are keeping our eyes open. Note these will be “trades” not investments at this point in time. We believe there is more money to be made in the space, but bad timing may be painful for those chasing easy money.
DigitalX (DCC) Monthly Chart
Question 5
“I have Telstra in three (3) portfolios which I operate.
Of the 3 portfolios the highest average buy price is $4.107 per share on a holding of xx shares.
In your view would it be in the best interests of the portfolio to either
1. hold the shares for the foreseeable future (say 12 to 24 months) in the hope of a better share price; or
2 buy more TLS to achieve a lower average buy price with a view to reducing the possible loss; or
3 Sell at around $3.70 and put the funds to better use."
- Thanks Frank R
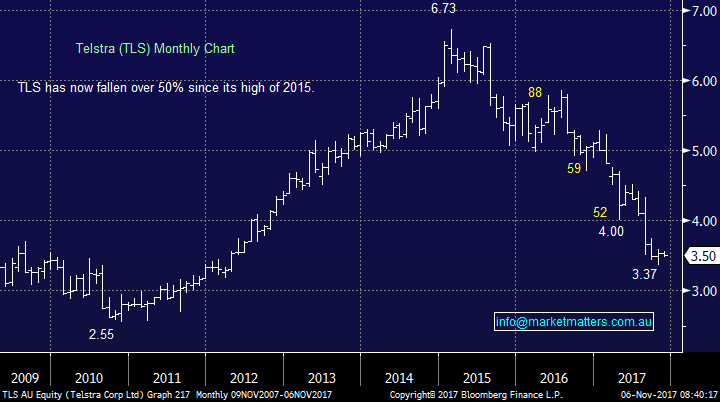
Morning Frank, I’m sure you understand when I start this answer by stating we cannot offer personal advice. We currently hold 10% of the MM Growth Portfolio in TLS from $3.70 and 5% in the Income Portfolio from $3.48 – after received recent dividends, the positions are around breakeven when netted off, our thoughts on our position:
- Our entry is ok as everyone now hates the stock, but it has a lot to prove before it can become a turnaround story.
- There is clearly huge room for improvement starting with customer service and moving up the business ladder.
- The sector is under pressure and clarity may be a few years away.
- We believe TLS is now an active investment / trading stock.
- Hence we are sellers around $3.70 and buyers under $3.30.
- If anything we would be more comfortable if our holdings were 5% and 3% respectively.
Telstra (TLS) Monthly Chart
Question 6
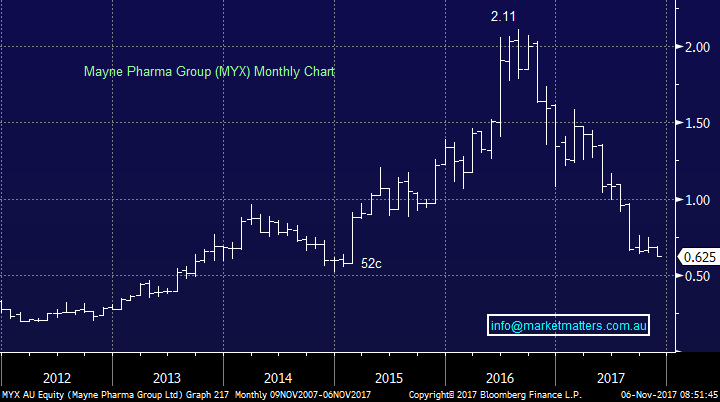
“Greeting MM, From time to time you mention a stock is X% in the hands of Short Sellers. The most recent being MYX (which I hold) with 10% being in the hands of Short Sellers. How do you determine whether it is Shorters or people just wanting to exit the stock?” - Cheers, Michael.
Morning Michael, a great question, any information which can used to improve our subscribers knowledge is awesome by us! We used the below site to maintain an eye on stocks that our catching / losing the appeal to short sellers. This can be used to see if short sellers are increasing their negative bets:
As you can see we hold IGO which has an enormous 19.2% short position, almost double that of Myer (MYR). Importantly a large short opposition is not a tick in our investment decision:
- A large short position means professional investors / traders / hedge funds believe the stock is overpriced / too expensive.
- These “traders” generally make money hence it’s not a tick for us.
- However, when they decide to exit, especially when they are wrong, a stock will surge.
- Let’s hope this is the case with IGO!
Mayne Pharma (MYX) Monthly Chart
Question 7
“I would appreciate any comments on CAT, ZNO & GO2” – Thanks Brian C. S.
Hi Brian, Please excuse the quick technical answers but I’m sure you understand due to the volume of questions:
- Catapult (CAT) $1.70 – looks bullish for a mover to $2.30 while $1.40 holds.
- Zoono Group (ZNO) 36.5c – looks poor.
- GO2 People Ltd 19c – sorry no idea, not much volume traded.
Question 8
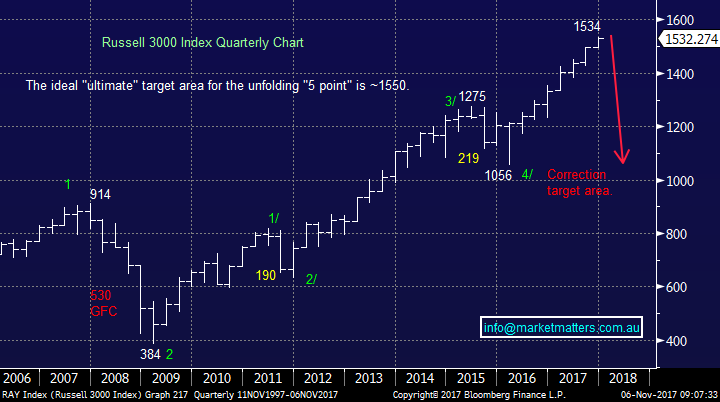
“I am becoming concerned that you much talked about 20% market correction which has now been pushed out time and time again over the past 2 years if simply a bad call and I feel that you are lately walking away from this call, is that correct ???” – Steve K.
Morning Steve, A great question which maybe I should have answered first, but unfortunately they are addressed in order I receive them. I feel you are being a little / very unfair with your assessment for the below reasons:
- We are 90% invested in stocks, not 50% missing out on the current gains.
- Remember we went to ~50% cash in 2015 before the major correction and we added huge value to our portfolios – we will move heavily to cash when we believe the top is close / in.
- One of our mantras is to remain openminded and if we have pushed back our timing of a top while staying long, I see no problem here.
- Our target for US indices back in 2015 are only being achieved now, the fact it has taking longer to be reached we have zero issue with.
Russell 3000 Quarterly Chart
Question 9
“MM, Twice I have asked where MM manages a portfolio which is managed and which can be invested in, but I have not received a response. As an MM member, I am interested.” – Thanks David.
Hi David, sorry, fairly sure I answered the question in a Monday report a few weeks ago however I write a lot and could be mistaken.
There are 2 options:
1 We can manage your funds now (350k upwards) aligned with the mm approach.
2 In the New Year, we hope to have 2 SMA options giving you the opportunity to invest at lower amounts.
I’m happy to discuss with you further. Cheers, James Gerrish
Question 10
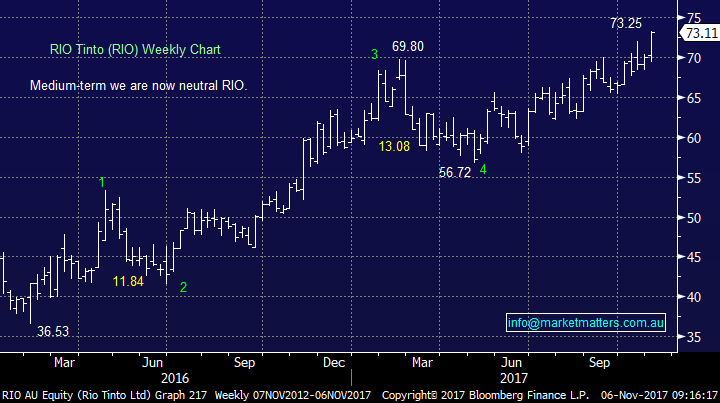
“Do you believe the continuing upward price in Rio shares is linked to the buyback? Is the share price likely to drop following conclusion of the offer on 10 November?” - Regards and thanks if you have time to include my question." - Regards Brian E.
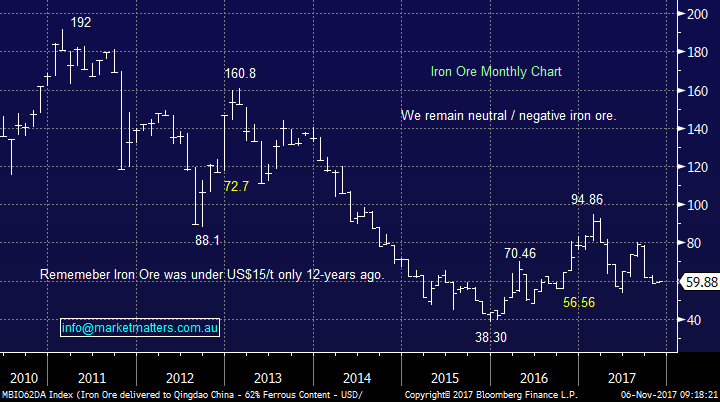
Hi Brian, the easy answer is yes, considering iron ore has collapsed over recent months. If anything we would be negative and wrong at this point in time! We are buyers of RIO, but maintain a distant $60 target area.
RIO Tinto Ltd (RIO) Weekly Chart
Iron Ore Monthly Chart
Overnight Market Matters Wrap
· The NASDAQ 100 continues to outshine the other US major indices, ending its session close to 1% higher last Friday, compared to the Dow and S&P 500 up marginally, yet in record territory.
· US Payrolls rose 261,000 in September, bouncing back strongly from the hurricane distorted August data, and unemployment fell to 4.1%, the lowest level since 2000.The average number of jobs added in the last 3 months was 162,000/month, highlighting the US is close to full employment.
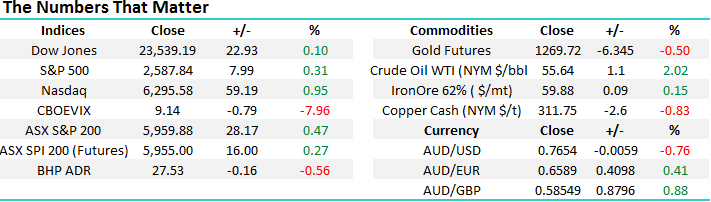
· Oil prices also continued their recent run with the Brent benchmark above US$62/bbl - the highest level for over 2 years - as the supply/demand outlook tightens, while other commodities were mixed. The continuing strength in the US$ saw the A$ weaken to us 76.5c.
· The December SPI Futures is indicating the ASX 200 to open 20 points higher testing the 5980 area this morning.
Disclosure
Market Matters may hold stocks mentioned in this report. Subscribers can view a full list of holdings on the website by clicking here. Positions are updated each Friday, or after the session when positions are traded.
Disclaimer
All figures contained from sources believed to be accurate. Market Matters does not make any representation of warranty as to the accuracy of the figures and disclaims any liability resulting from any inaccuracy. Prices as at 06/11/2017. 8.00AM.
Reports and other documents published on this website and email (‘Reports’) are authored by Market Matters and the reports represent the views of Market Matters. The MarketMatters Report is based on technical analysis of companies, commodities and the market in general. Technical analysis focuses on interpreting charts and other data to determine what the market sentiment about a particular financial product is, or will be. Unlike fundamental analysis, it does not involve a detailed review of the company’s financial position.
The Reports contain general, as opposed to personal, advice. That means they are prepared for multiple distributions without consideration of your investment objectives, financial situation and needs (‘Personal Circumstances’). Accordingly, any advice given is not a recommendation that a particular course of action is suitable for you and the advice is therefore not to be acted on as investment advice. You must assess whether or not any advice is appropriate for your Personal Circumstances before making any investment decisions. You can either make this assessment yourself, or if you require a personal recommendation, you can seek the assistance of a financial advisor. Market Matters or its author(s) accepts no responsibility for any losses or damages resulting from decisions made from or because of information within this publication. Investing and trading in financial products are always risky, so you should do your own research before buying or selling a financial product.
The Reports are published by Market Matters in good faith based on the facts known to it at the time of their preparation and do not purport to contain all relevant information with respect to the financial products to which they relate. Although the Reports are based on information obtained from sources believed to be reliable, Market Matters does not make any representation or warranty that they are accurate, complete or up to date and Market Matters accepts no obligation to correct or update the information or opinions in the Reports.
If you rely on a Report, you do so at your own risk. Any projections are estimates only and may not be realised in the future. Except to the extent that liability under any law cannot be excluded, Market Matters disclaims liability for all loss or damage arising as a result of any opinion, advice, recommendation, representation or information expressly or impliedly published in or in relation to this report notwithstanding any error or omission including negligence.
To unsubscribe. Click Here