Subscriber Questions (CBA, CYB, STO, CGC, TLS)
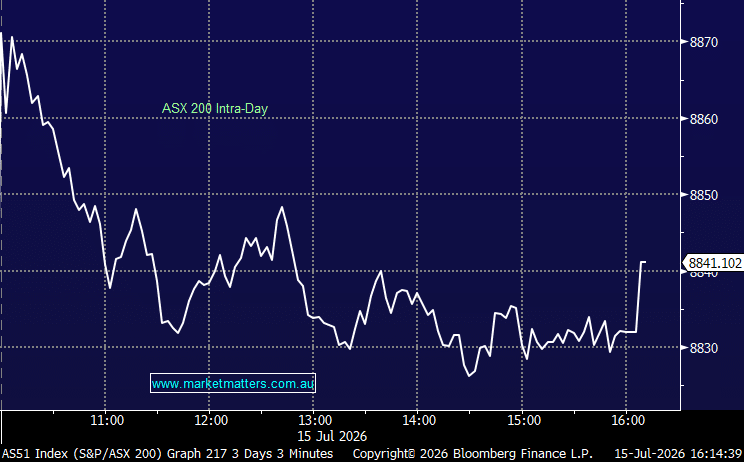
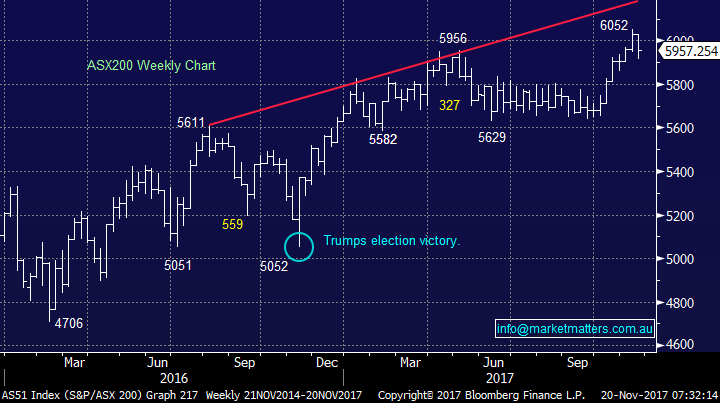
The ASX200 finally experienced a consolidation week following its 7% surge since early October. From a seasonal perspective the -2.25% pullback over recent days is around half of the norm in both price and time i.e. we would usually expect to see another week of choppy price action from local stocks before investors start considering the “Santa window dressing rally”, although this does not usually really kick in until mid-December.
- Since the GFC the ASX200 has corrected on average over 5% from this period in November – usually over this 10-20th period.
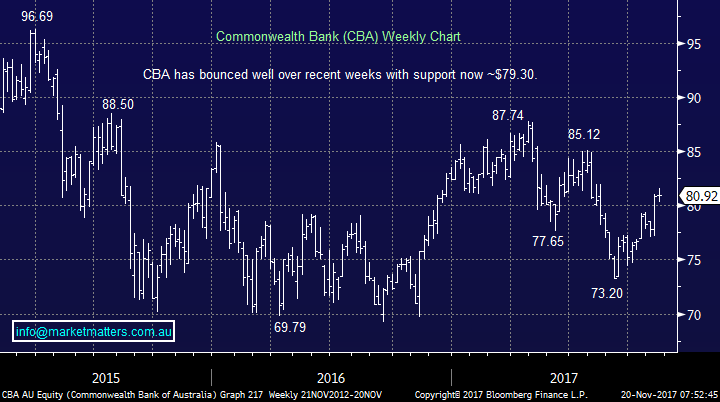
- Since the GFC the Commonwealth Bank (CBA) has corrected on average over 6% from this period in November – not apparent yet this year.
- Historically this pullback has provided an excellent buying opportunity for the traditional “Christmas Rally”.
This week we have again received an excellent volume of questions, we’ve covered 5 in this morning’s report - we are sorry if we could not get to yours but most importantly thanks, keep them coming!
ASX200 Weekly Chart
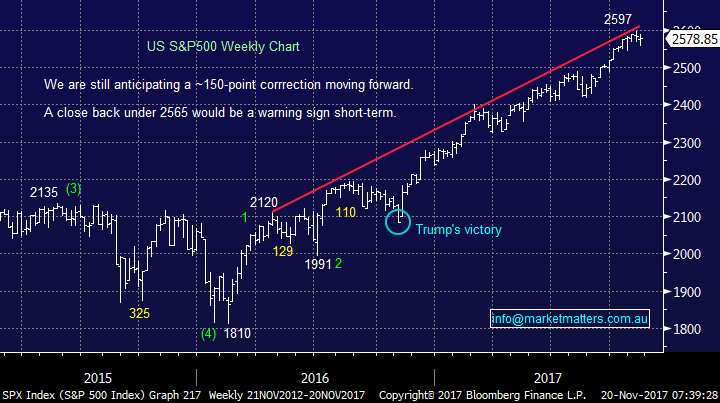
We still believe the US S&P500 is “looking for a top” but following last weeks failed attempt on the downside another test of the psychological 2600 area would not surprise i.e. ~1% higher. On balance if we were specifically looking at US stocks we would continue to increase our cash levels in anticipation of a reasonable correction.
US S&P500 Weekly Chart
Question 1
“Hi Market Matters. Over the last few months you’ve taken profit on your CYB Plc (CYB) position and part of the CBA position but now they appear to be the banks you will most likely buy in the near future, I’m confused” – Regards Mark B.
Morning Mark, a great question that most definitely deserves an answer! I will answer in 3 stages which will hopefully explain our thoughts / logic behind the decisions to-date:
- We took part profit on our CBA position in our Growth Portfolio for 3 reasons, firstly the seasonal statistic which shows that CBA usually corrects over $6 at some point in November, secondly because our other banking positions in BOQ, NAB and WBC were all trading ex-dividend in November leading to the thought of a potential switch from one of these holdings into CBA and thirdly we simply had a huge exposure to the banking index and following its +8% rally since September we felt it was an opportune time to lock in some profits and observe.
Commonwealth Bank (CBA) Weekly Chart
- We took a nice profit on a CYB position simply because it had reached our target area i.e. “Plan your trade and trade your plan – equally adapt to investing”.
CYBG Plc (CYB) Weekly Chart
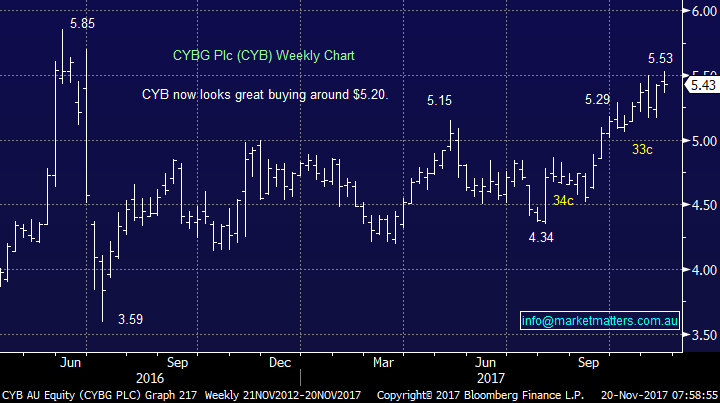
3. When we look back at the reasons for our sells in CBA and CYB they both still make sense to us but the market has since evolved and our plans must remain fluid, just like the market itself. So far Australian banks have remained strong in November and considering our bullish opinion on them into 2018 this may be the year that defies the statistics. Hence our current thinking:
(1) We are considering taking a 5-6% profit on our BOQ position, including a large fully franked dividend i.e. a 5% holding in the Growth Portfolio.
(2) We are considering taking our holding in CBA to 10% with one eye on its dividend in February – we are definitely not too proud to pay a higher price than our recent sale level.
(3) We are considering buying back into CYB around $5.20.
Question 2
“Hi, I bought Santos (STO) for 5.01 when should I exit thanks” – Sharon & Tony B.
Morning Mark, A good question however worth highlighting at this point that MM is all about general commentary and is not about what you should do. STO is a complex beast at present but these are our key takeout’s that are at the forefront of our thinking.
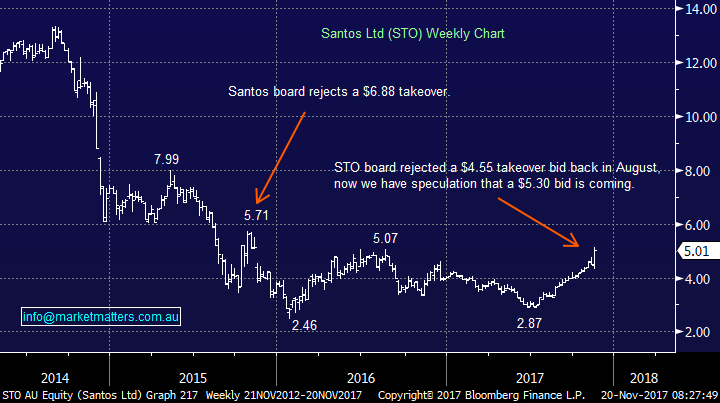
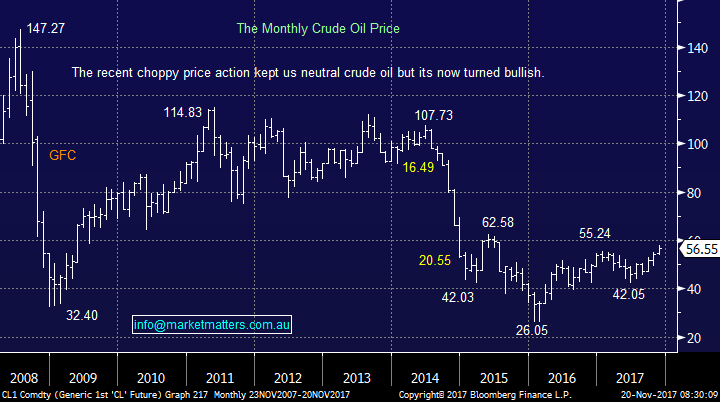
- At MM we are bullish crude oil with a potential target up towards $US70/barrel – the following 2 charts illustrate perfectly how the STO share price tracks the oil price very closely. Hence if Crude can rally over 20% as we think then STO is likely to perform very well.
- Last week STO rallied +11.6% while the other players in our energy sector slipped due to Shell’s placement of its Woodside (WPL) shares.
- Hence if the cautious optimism around the STO takeover vanishes STO is likely to struggle short-term – we say cautious because STO is trading over 5% below the apparent takeover offer.
- We cannot see the unpredictable STO board accepting a bid at $5.30 for STO.
- The Foreign Investment Review board is likely to be significant hurdle for any takeover of STO.
- Short-term we must be 50-50 at best on STO but we do remain bullish the energy sector medium term.
Also worth commenting here that we don’t put much emphasis on the price paid for a stock believing that it should have no real influence on any decision making moving forward. It is a tough human emotion to fight however assessing a stock in the present without the biases of price paid, is one of the keys to success.
Santos (STO) Weekly Chart
Crude Oil Monthly Chart
Question 3
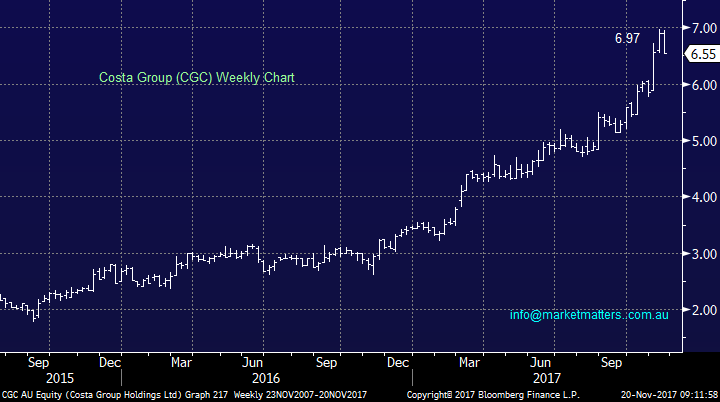
“Hi, I have been watching Costa Group CGC with a PE of above 32 over the last year. It’s gone from $2 to just under $7 in a year but when I see a PE of above 30 I walk away. Should I consider other factors?" – Thanks Mark H.
Hi Mark, you definitely need to look at the company’s growth potential in the years ahead as opposed to today’s P/E otherwise you are likely to miss some of the best performing stocks out there. This risk obviously comes when a company becomes ex-growth and we get the reduction in the markets multiple at a time when earnings are potentially falling, or at least not growing as fast, for instance, if a company is on 30x and it’s growing earnings at 20% yoy everything is rosy. If however, a company matures, and earnings growth is at 5%, a multiple of 15-20x (depending on how predictable the earnings are) makes more sense. That will often coincide with a big fall in share price. e.g. over the last year market favourite Domino’s Pizza (DMP) -33%.
Although we like this business, we feel we’ve most likely missed the boat unless a decent pullback unfolds.
Costa Group (CGC) Weekly Chart
Question 4
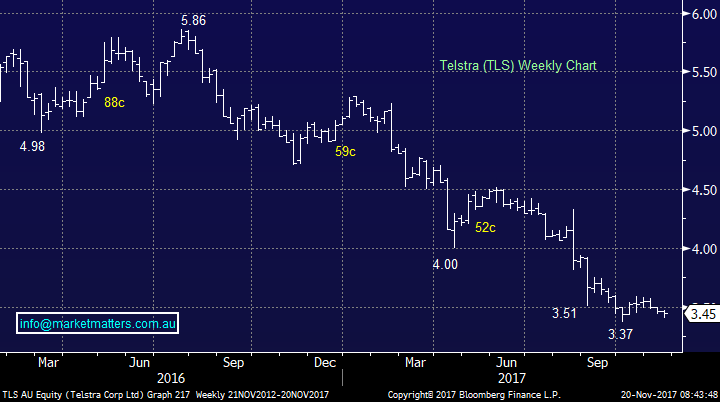
“My old hobby-horse topic. How much longer are you going to hang on to Telstra? Down another 3c today. I just can’t be tempted at present. There surely must be a better use of those funds in the Growth Portfolio.” – Paul H.
Morning Paul, you certainly do try and keep us on our toes! We are currently down under 3% on our TLS holding but our concerns are not quite as deep as yours, remember we are ahead in TLS over the last few years unlike many:
- We actually believe TLS is now a turnaround story and anybody who has dealt with the company over the last year would I’m sure acknowledge there is huge room for improvement!
- The whole sector is extremely unpopular at present, remember how everyone felt about BHP when it was around $14.
- We feel their current 6.4% fully franked dividend is ok and should support the stock – next dividend is due in February.
- At MM we perceive TLS is now a stock that should be played with an active approach searching for “free” dividends.
- However TLS is clearly in a bearish downtrend and they can often last much longer than many expect, again who thought BHP would trade near $14 when it had halved from over $40 to $20.
In conclusion we like our 5% holding of TLS in the Income Portfolio but are mindful that 10% in the Growth Portfolio is probably too large – 5%, is probably more appropriate. We discussed this in reports last week.
Telstra (TLS) Weekly Chart
Overnight Market Matters Wrap
· The US equity markets closed lower last Friday, as investors begin to take risk off the table and look for “safer” assets during this time of uncertainty with no real catalyst to move the markets on either direction.
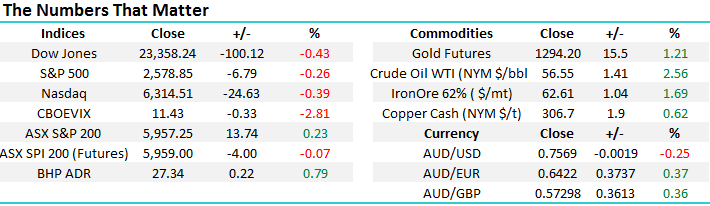
· Gold futures rallied 1.21% to US$1,294.20/oz. as per above, while on the treasury front, the yield curve also continues to flatten with US 2 year yields at nine year highs of 1.73% as investors bank on short term rates increasing from next month as the Fed progressively tightens into 2018.
· The December SPI Futures is indicating the ASX 200 to open marginally lower, towards the 5950 level this morning.
Disclosure
Market Matters may hold stocks mentioned in this report. Subscribers can view a full list of holdings on the website by clicking here. Positions are updated each Friday, or after the session when positions are traded.
Disclaimer
All figures contained from sources believed to be accurate. Market Matters does not make any representation of warranty as to the accuracy of the figures and disclaims any liability resulting from any inaccuracy. Prices as at 20/11/2017. 8.00AM.
Reports and other documents published on this website and email (‘Reports’) are authored by Market Matters and the reports represent the views of Market Matters. The MarketMatters Report is based on technical analysis of companies, commodities and the market in general. Technical analysis focuses on interpreting charts and other data to determine what the market sentiment about a particular financial product is, or will be. Unlike fundamental analysis, it does not involve a detailed review of the company’s financial position.
The Reports contain general, as opposed to personal, advice. That means they are prepared for multiple distributions without consideration of your investment objectives, financial situation and needs (‘Personal Circumstances’). Accordingly, any advice given is not a recommendation that a particular course of action is suitable for you and the advice is therefore not to be acted on as investment advice. You must assess whether or not any advice is appropriate for your Personal Circumstances before making any investment decisions. You can either make this assessment yourself, or if you require a personal recommendation, you can seek the assistance of a financial advisor. Market Matters or its author(s) accepts no responsibility for any losses or damages resulting from decisions made from or because of information within this publication. Investing and trading in financial products are always risky, so you should do your own research before buying or selling a financial product.
The Reports are published by Market Matters in good faith based on the facts known to it at the time of their preparation and do not purport to contain all relevant information with respect to the financial products to which they relate. Although the Reports are based on information obtained from sources believed to be reliable, Market Matters does not make any representation or warranty that they are accurate, complete or up to date and Market Matters accepts no obligation to correct or update the information or opinions in the Reports.
If you rely on a Report, you do so at your own risk. Any projections are estimates only and may not be realised in the future. Except to the extent that liability under any law cannot be excluded, Market Matters disclaims liability for all loss or damage arising as a result of any opinion, advice, recommendation, representation or information expressly or impliedly published in or in relation to this report notwithstanding any error or omission including negligence.
To unsubscribe. Click Here