Subscriber Questions (KIN, CGF)
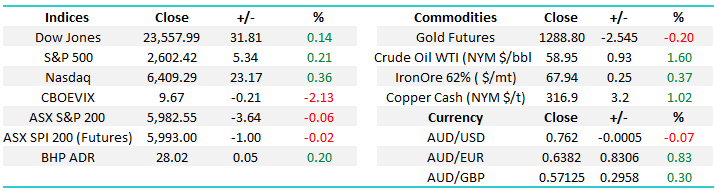
The ASX200 had another fairly quiet week which is pretty common with the US Thanksgiving holiday sending most American fund managers into a turkey slumber. With December arriving on Friday it will be interesting to see if / when any Christmas window dressing rally occurs.
- Our “Gut Feel” at MM is the ASX200 will say goodbye to 2017 around the 6150 level i.e. this would be an impressive 8.6% gain for the year.
- Hence we are still considering buying weakness and will be fussy when we significantly increase our cash levels.
This week we have received a diverse group of questions and we’ve covered 5 of them in this morning’s report.
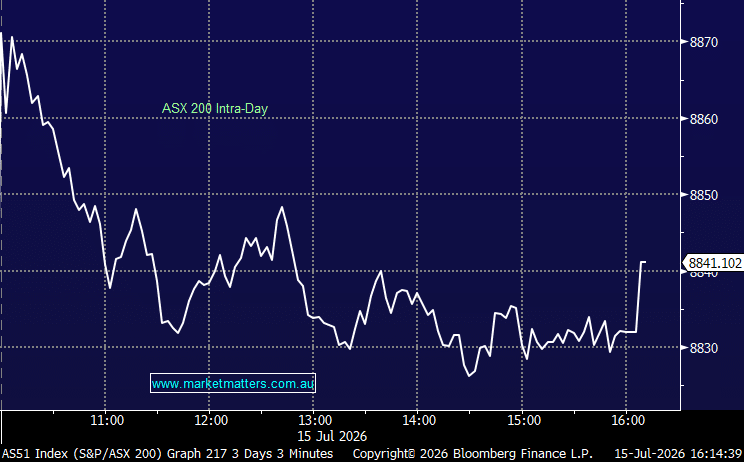
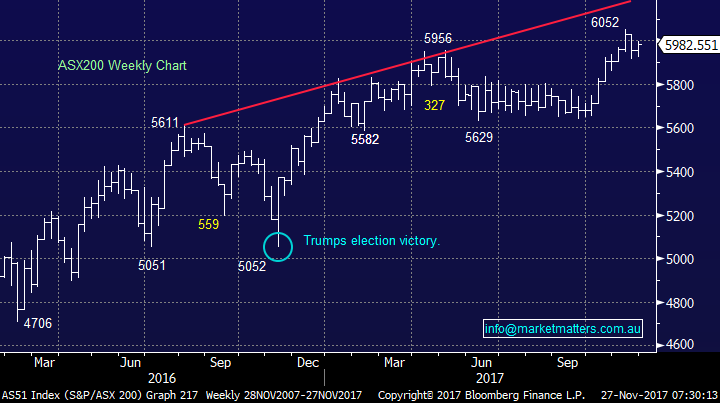
ASX200 Weekly Chart
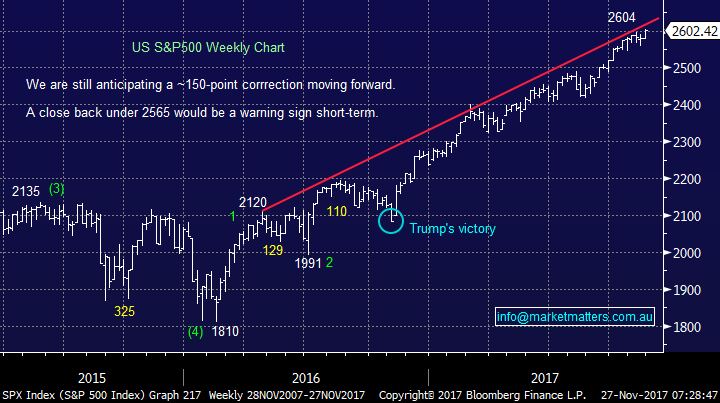
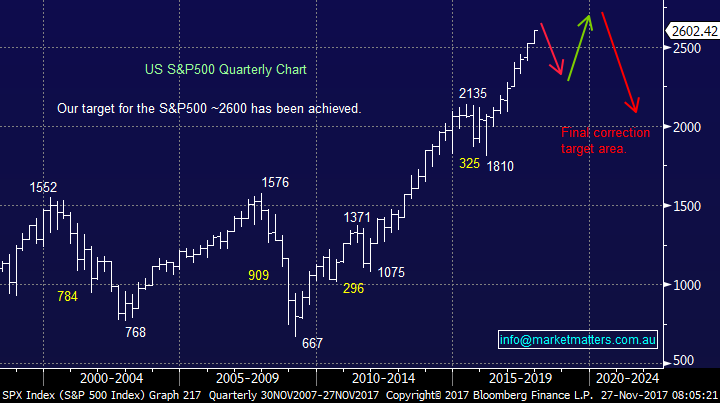
We still believe the US S&P500 is “looking for a top” but following the failed attempt on the downside 2 weeks ago further “choppy” strength into Christmas now feel likely. On balance if we were specifically looking at US stocks we would continue to increase our cash levels in anticipation of a reasonable correction.
US S&P500 Weekly Chart
Question 1
“Hi MM, If you believe that stocks may put a reasonable top in place around the end of December / start of January what cash levels do you anticipate holding in your portfolio if this occurs?” – Regards Steve E.
Morning Steve, a very relevant question that we will answer from a relatively simple perspective, which can often be the best angle. Firstly lets stick our neck out and outline how we see 2018 unfolding:
- We see a classic Christmas rally unfolding which potentially will take the ASX200 3-4% higher.
- MM then expects a classic “warning shot across the bow” of the bull market, which commenced back in March 2008 i.e. the first red down arrow on S&P chart – even 1987 gave us one of these before the October crash.
- Ideally we will then see fresh all-time highs for US stocks before a major correction of the bull market – see full potential roadmap in S&P chart below.
Hence if the market gyrates higher as expected our plans will probably resemble the below – having picked the eyes out of the 2015 high and 2016 low we are going for 3rd time lucky!
- My best guess is we will be holding 20-25% of the MM Growth Portfolio in cash by the end of December looking for a decent, but not huge, correction to buy again for a blow off style top.
- Assuming markets stay on track we anticipate holding ~50% in cash later in 2018 plus potentially some negative facing ETF’s – similar to our position around the top of 2015.
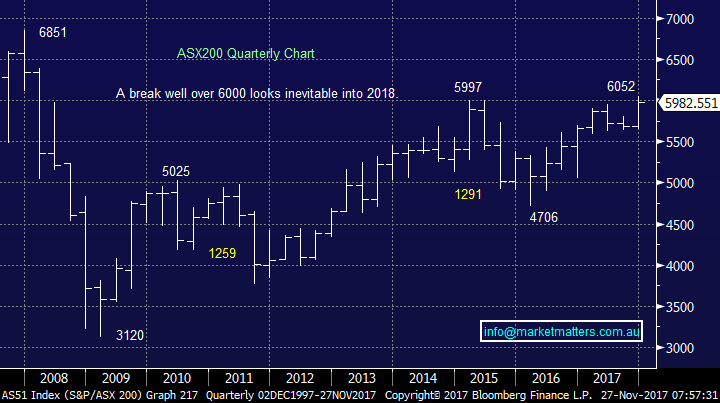
ASX200 Quarterly Chart
US S&P500 Quarterly Chart
Question 2
“After this week’s AU /USD predictions any thoughts on an ETF to follow that trend USD.ax ? or is there a better one” - cheers Michael D.
Morning Michael, we don’t trade around our currency forecasts but only use them to assist in stock / sector selection within MM portfolio’s. There are numerous ways of playing an AUD view from pure FX markets to futures and ETF’s. The simplest way in our view is through an ETF listed on the ASX. The USD.AXW gives exposure to a rising US Dollar versus the Aussie, so would benefit from a weakening local currency versus the greenback.
To clarify how we see both the $USD and AUD from a technical perspective in coming weeks / months:
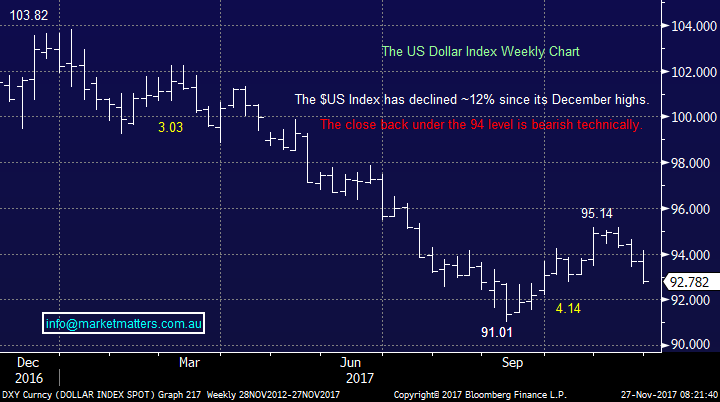
- We see the USD Index continuing its aggressive downtrend of 2017 targeting the 90 level / 3% lower.
- After completing ~13% correction over the year we expect to see a 5-6% countertrend bounce by the $US Index.
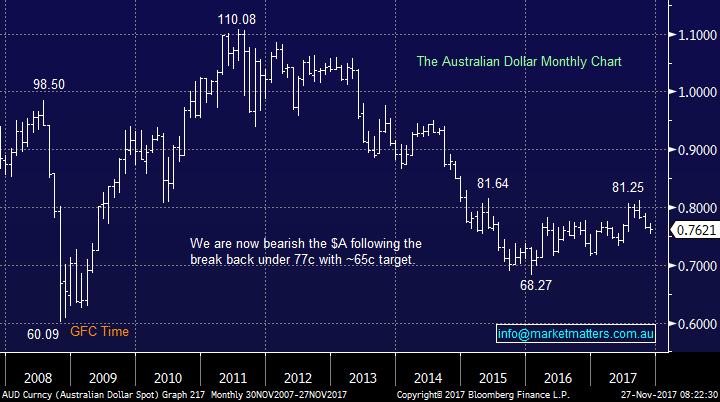
Hence although we ultimately have a 65c target for the $A it may easily spike up towards 77-78c if the $US Index tumbles 3%. We will be watching for any $US weakness that may flow over into the local stocks who generate revenue in the US, we will regard this as a buying opportunity.
US Dollar Index Weekly Chart
The AUDUSD Monthly Chart
Question 3
“Kin Mining NL were awarded the Diggers and Dealers Best Emerging Company Award 2017. What is your view of Kin Mining as it moves towards initial production and a “Clear Pathway to Cashflow in 2018”. “ – Thanks Phil B.
Hi Phil, thanks again for a topical question – you’ve taken us out of our comfort zone in the junior mining space.
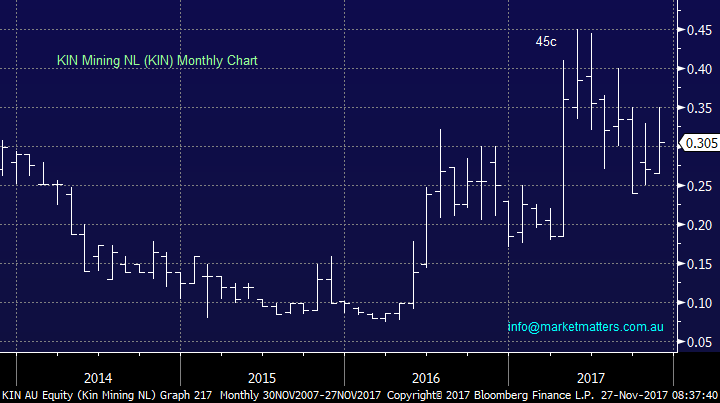
For some background, KIN has a reasonably small market cap. of $53.6m making it impossible for us at MM to invest in – simply, liquidity is not enough for us given the volume we typically trade. The stock is clearly very speculative regularly moving 25% per month and occasionally 50%! If we do venture into this area, we are very careful with rallies in small companies around news e.g. KIN has fallen since the Diggers and Dealers Award in August. Often we see the old adage of buy the rumour sell the fact play out. I’m also very conscious of mining companies (or any small caps) transitioning from a dream to a cash generating reality. By that I mean a company typically tells a very optimistic story in their early stages which they need to do to raise exploration capital, but the proof is always in the pudding, and that puddling often doesn’t look or taste as good as it was described when they were out shopping for the ingredients!
Our view for the bulls from purely a technical perspective would be a buy under 30c with stops under 18c which is clearly a huge % risk illustrating the current speculative nature of the stock.
KIN Mining NL (KIN) Monthly Chart
Question 4
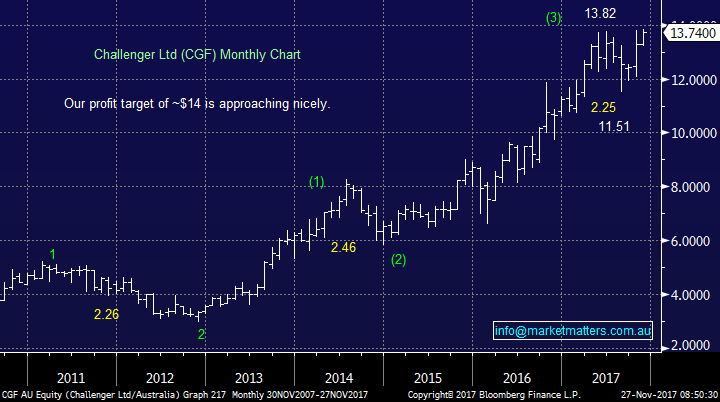
“A quick question, you are considering taking profit on CGF but all brokers still like it?” – thanks Nigel S.
Hi Nigel, good job you got this question in today as we may have already sold by Friday!
- We bought CGF in late September, under $12, targeting a rally over $14. This may potentially unfold this week with CGF less than 2% below $14.
The fact that all brokers / analysts love CGF is a supporter of our view to take profit ~$14. If everyone’s bullish and long where will the marginal buyers come from to drive the share price over $14 and up towards $15? Over the last 6-years CGF has already experienced 3 corrections of well over $2 and we can see this occurring again in 2018.
- We believe we will be able to take 17% profit on CGF over $14 and buy back into the company under $12 later in 2018.
This a great example of how we are playing a stock alongside our overall view for equities into 2018 which was outlined earlier.
Challenger Ltd (CGF) Monthly Chart
Question 5
“I would like to view share prices of companies not put in the daily West Australian. In particular GME Resources NMT Gold or is it NTM Gold, Kin Mining.” - David F
Hi David, thanks for an easy one today! Simply go to the ASX website, link is below, for all prices on stocks traded on the ASX with only a slight delay, much easier than a newspaper.
http://search.asx.com.au/s/search.html?query=gme&collection=asx-meta&profile=web
Overnight Market Matters Wrap
· A quiet session was experienced in the US last Friday, following Thanksgiving from the previous day, with all major indices up marginally.
· The retail and e-retail stocks outperformed the broader market as Adobe analytics showed US consumers spent more than US$2.87B online thanks to ‘Black Friday’ sales.
· A quiet session is expected today, with no major economic data expected to report today.
· The December SPI Futures is indicating the ASX 200 to open marginally higher, testing the 5985 level this morning.
Disclosure
Market Matters may hold stocks mentioned in this report. Subscribers can view a full list of holdings on the website by clicking here. Positions are updated each Friday, or after the session when positions are traded.
Disclaimer
All figures contained from sources believed to be accurate. Market Matters does not make any representation of warranty as to the accuracy of the figures and disclaims any liability resulting from any inaccuracy. Prices as at 27/11/2017. 8.00AM.
Reports and other documents published on this website and email (‘Reports’) are authored by Market Matters and the reports represent the views of Market Matters. The MarketMatters Report is based on technical analysis of companies, commodities and the market in general. Technical analysis focuses on interpreting charts and other data to determine what the market sentiment about a particular financial product is, or will be. Unlike fundamental analysis, it does not involve a detailed review of the company’s financial position.
The Reports contain general, as opposed to personal, advice. That means they are prepared for multiple distributions without consideration of your investment objectives, financial situation and needs (‘Personal Circumstances’). Accordingly, any advice given is not a recommendation that a particular course of action is suitable for you and the advice is therefore not to be acted on as investment advice. You must assess whether or not any advice is appropriate for your Personal Circumstances before making any investment decisions. You can either make this assessment yourself, or if you require a personal recommendation, you can seek the assistance of a financial advisor. Market Matters or its author(s) accepts no responsibility for any losses or damages resulting from decisions made from or because of information within this publication. Investing and trading in financial products are always risky, so you should do your own research before buying or selling a financial product.
The Reports are published by Market Matters in good faith based on the facts known to it at the time of their preparation and do not purport to contain all relevant information with respect to the financial products to which they relate. Although the Reports are based on information obtained from sources believed to be reliable, Market Matters does not make any representation or warranty that they are accurate, complete or up to date and Market Matters accepts no obligation to correct or update the information or opinions in the Reports.
If you rely on a Report, you do so at your own risk. Any projections are estimates only and may not be realised in the future. Except to the extent that liability under any law cannot be excluded, Market Matters disclaims liability for all loss or damage arising as a result of any opinion, advice, recommendation, representation or information expressly or impliedly published in or in relation to this report notwithstanding any error or omission including negligence.
To unsubscribe. Click Here