Subscriber Questions (MXT, ORE, MQA, SUN, WPL, JHG, ORG, STO)
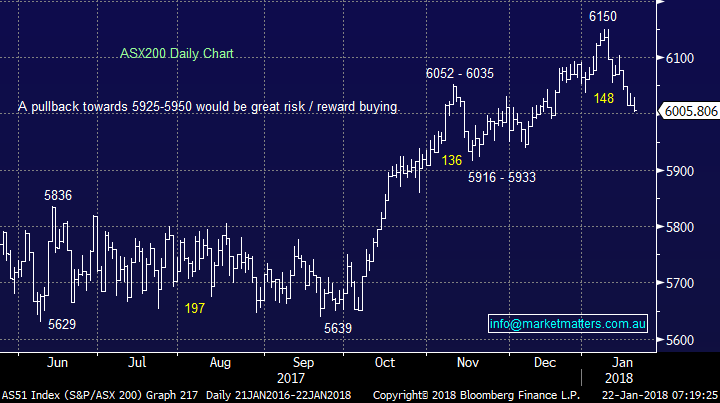
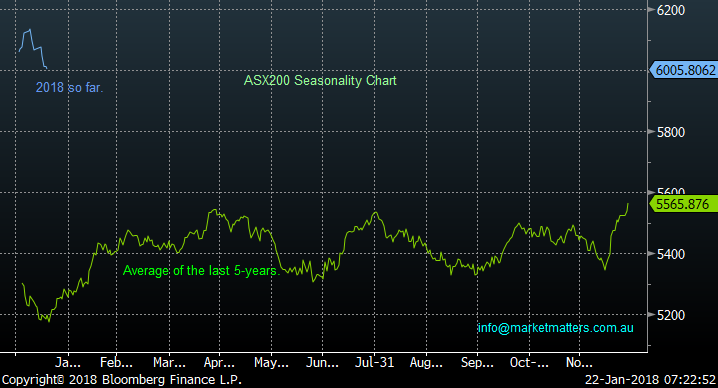
The ASX200 has struggled to-date in 2018, however it’s worth remembering that this is seasonally typical for the local index which usually needs a rest after its made us all smile with a strong end of year / Santa rally. If the market is going to follow its usual pattern since the GFC we should see a low for January this week but the low for Q1 of 2018 is not likely until the first 5-10 days of February. Hence MM are happy accumulators into weakness but are not chasing any strength at this point in time.
Markets are waking up this morning to another US Government shutdown, this is more of an embarrassment to the US than a huge negative for their stock market but after such a strong advance since Donald Trump’s election victory picking the catalyst which will finally cause a 5-6% correction is tough at best. Historically, Govt shutdowns such as those in in 1995, 1996, and 2013, have not been catalysts for market weakness however given the run we’ve seen in the US and the low cash balances of US Funds, the 2018 shutdown could well be an anomaly. Another vote happened shortly and US Futures markets will likely drive our mkt this morning.
- Our “Gut Feel” at MM is the ASX200 will reach the 5925-5950 support area in the next few weeks.
This week we have again received an excellent group of questions and we’ve covered 6 topical issues in this morning’s report.
ASX200 Daily Chart
ASX200 Seasonality Chart
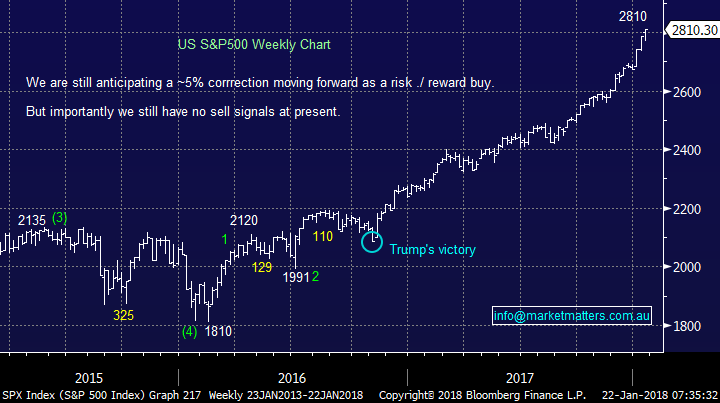
The US S&P500 is enjoying its longest run in history without a 5% correction, from a risk / reward perspective we cannot be buyers until we see such a pullback.
US S&P500 Weekly Chart
Question 1
“Hi MM, We are wondering about getting back into some of Santos STO shares - after their previous and recent good news reports? Do you have any insights as to where the current upwards trend since June 2017 might end, perhaps it might reach 2015 levels $7.50 before April? What would you do if you owned it today?" - Regards and Thanks, Phil.
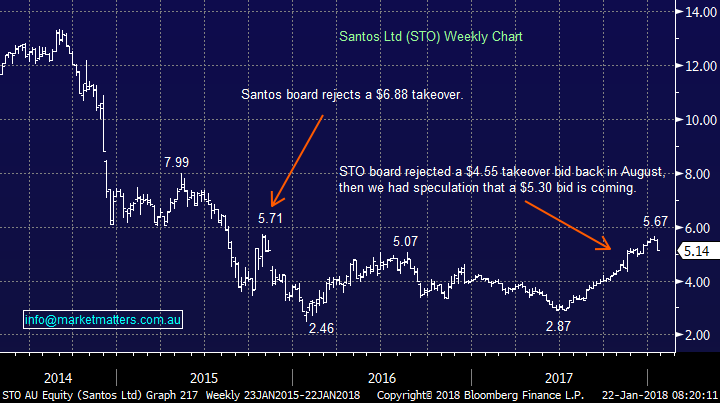
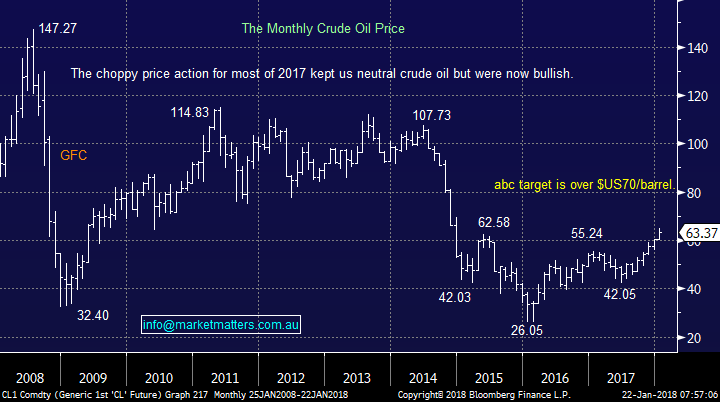
Morning Phil, We’ve been considering both Santos and Origin as more aggressive buys / trades to complement our position in Woodside (WPL) and overall view that crude oil can reach $US70/barrel in 2018/9.
As you point out the bull market is already ~2-years old although STO has struggled at times compared to the overall energy sector. Hence the buying level becomes very important as aggressive / sharp pullbacks become ever increasingly likely.
- Santos (STO) – STO has corrected 9.5% over the last 2-weeks, our ideal buying level under $4.90 – a break back under $4.65 would be a major concern.
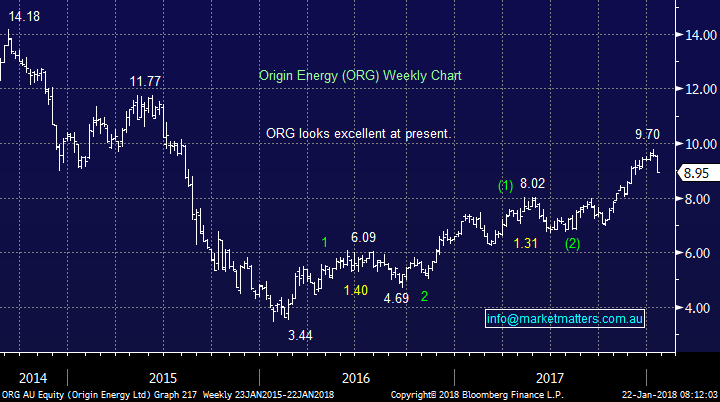
- Origin (ORG) – ORG has corrected 7.7% over the last 2 weeks, our ideal buying level is $8.50-8.75 – a break back under $8 would be a major concern.
On balance MM prefers ORG at this stage. We anticipate the trend ending when crude reaches the ~US70/barrel area.
Santos (STO) Weekly Chart
Origin (ORG) Weekly Chart
Crude Oil Monthly Chart
Question 2
“Hi Vanessa, I have some JHG and WPL in my portfolio based on an email alert a while ago. Should I continue to hold those?” – Regards Luke
Morning Luke, thanks for the question. Worth reiterating again that at MM we write about our own views and actions, our own take on markets, not about what a reader should do themselves.
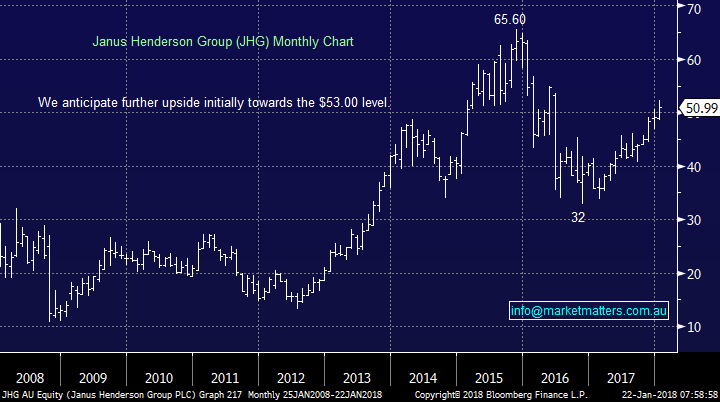
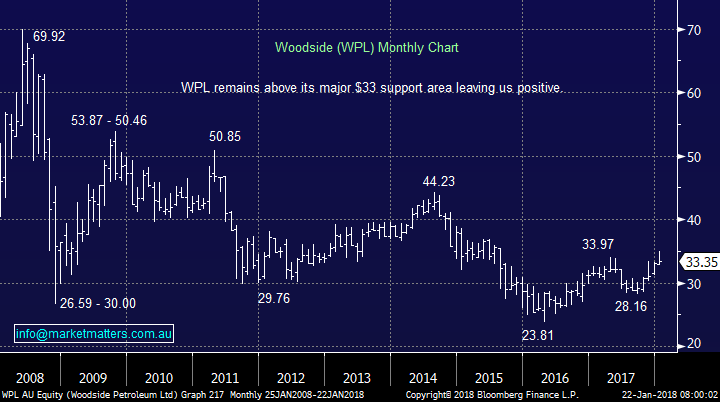
We own both Janus Henderson (JHG) and Woodside (WPL) and importantly at this point in time, happily so. We will be concerned if JHG breaks back under $46 or if crude oil shows us signs of failing on its advance towards $US70/barrel.
As always, watch for alerts.
Janus Henderson (JHG) Monthly Chart
Woodside Petroleum (WPL) Monthly Chart
Question 3
“Hi , I am a new subscriber to MM, and I am finding it an excellent service, with all your reports and the excellent trading guidance. I was interested in your question and answer segment on Monday morning. In particular Q4, I too are thinking of some international exposure, but not sure whether now is the right time, given the massive gains on the US market. I note your chart #9 and also the US S&P 500chart I don't want to go in ahead of a major correction.” - Regards John D.
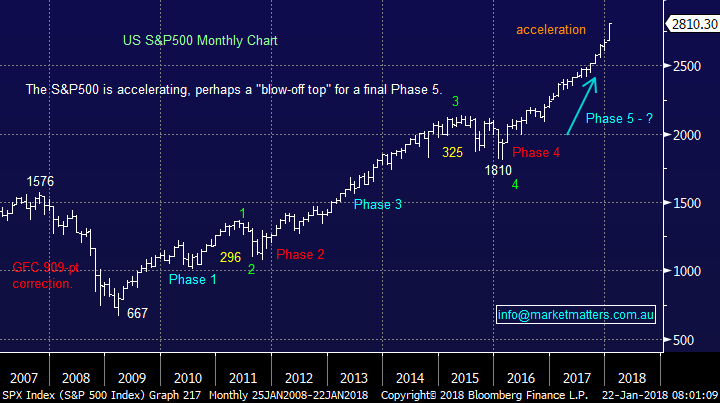
Morning John, we find it hard to be excited by the US S&P500 short-term as its enjoying its longest rally in history without a 5% correction. If we were looking to buy the US we would be patiently targeting the next 5-6% pullback. We do believe US stocks have more upside but we stick with our medium-term view that a more aggressive pullback is slowly raising its head on the horizon hence any buying we feel should be “nimble in nature”.
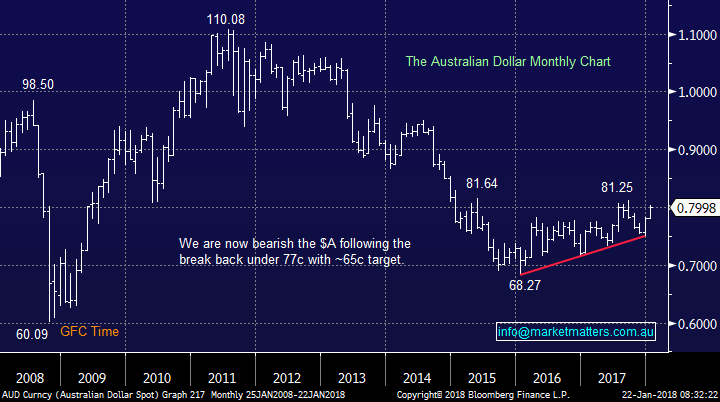
Depending on what vehicle you are considering the AUDUSD exchange rate is an important part of the puzzle. Our technical view is the $A can trade down towards 65c over the coming years hence a 5-6% pullback in US stocks while $A is trading up close to 80c generates fairly exciting buying levels. Exchange Traded Funds (ETFS) such as the IVV which tracks S&P 500 in our view are the easiest vehicles to gain overseas exposure.
US S&P500 Monthly Chart
The Australian Dollar ($A) Monthly Chart
Question 4
“Thank you for the information sent with regard to the Growth Portfolio. I have been following your portfolio and throughout this week have mirrored it to my portfolio. I am reasonably inexperienced so I have a question or two, please. I have not invested anything in SUN, NCM nor TLS as you have these as HOLD positions. Should I wait for these to move to BUY before adding these to my portfolio? On another note, I am also holding ANZ, AQC, CIM, CWN, MQA and TWE from my "old" portfolio. What is your opinion on what to do with these? Should I sell these to mirror your growth portfolio exactly?” - Thanks in advance, Greg T.
Morning Greg, thanks for the question but as its very large in nature please excuse the brevity of our answer in places. Furthermore and as mentioned above, we simply provide general advice / commentary on stocks / markets, for a more personalised approach we would need to refer you to our team at Shaw and Partners who can provide more personalised advice.
Holds in the MM Growth Portfolio
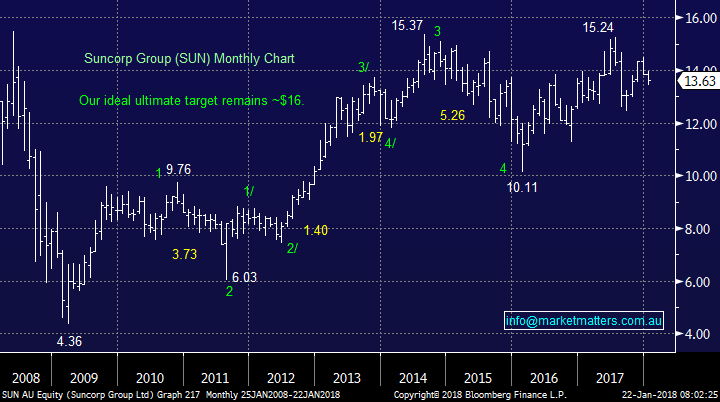
SUN – we like SUN and importantly it should benefit from rising interest rates, we like SUN under $13.40.
NCM – if we did not have a position we would not be buying NCM at this stage and are likely to sell our holding in coming weeks / months.
TLS – we would be buyers again in the $3.25-$3.30 area.
Stocks you mentioned
ANZ – we like the banks into weakness but can see ANZ breaking its $27.90 support short-term.
AQC – not a stock we are close to, it looks “heavy” at present.
CIM – the stock looks great technically and we think the purchase of UGL was a good one, however if we owned, it would be tempting to take some $$$ off the table and follow the rest with a trailing stop
CWN – we are neutral to marginally positive Crown (CWN) at present.
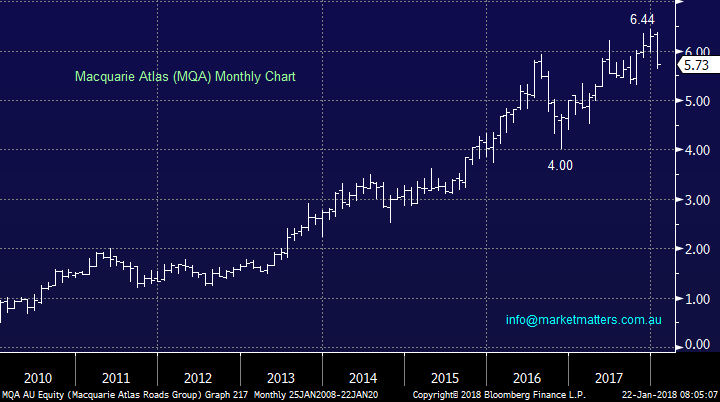
MQA – we not keen on the “yield play” / bond proxy stocks and this includes MQA.
TWE – very similar to all comments on CIM.
Suncorp (SUN) Monthly Chart
Macquarie Atlas (MQA) Monthly Chart
Question 5
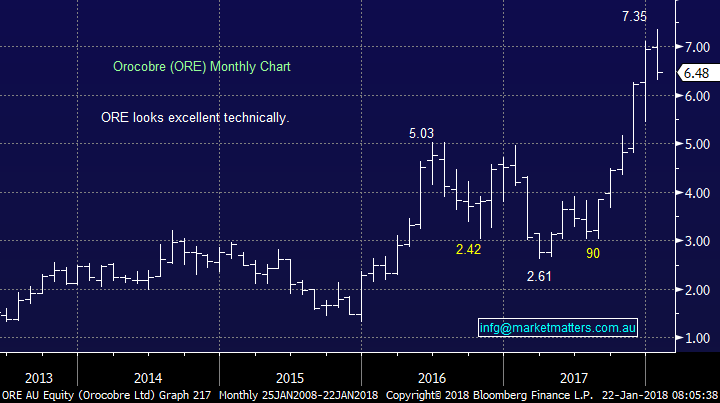
“Hi Guys, brought ORE on Friday and wanting to set upper and lower stops. Can you let me let me know your target price range for this ORE? It would be really good if you included a target price range for a stock at the time of sending out the buy alerts.” – Thanks Ian B.
Morning Ian, While we are medium-term bullish ORE, our short term targets sit in the range of $7.50-$8. That said, another bad day and we may increase our position slightly but only well under $6.
Question 6
"Hi Guys Re ORE. I cannot understand why, after issuing an intention to buy into weakness under $7 this morning, you waited until 6 minutes before the close of the market to release a
“Buy” alert of 3% at a limit of $6.45. I watched the stock on and off all day and observed it falling to circa $6.30 at around 3:30pm…..but still no buy alert from MM. By the time you issued the “Buy” alert at 3:54pm your limit of $6.45 had already been exceeded. Needless to say, I didn’t get set. Tongue in cheek, one hopes that a long Friday lunch didn’t get in the way of timely advice." Regards Errol K.
Thanks Errol. Firstly, a long Friday lunch was not to blame although I do enjoy the odd steak around the Sydney CBD! Happy to take you for one if you are in the area!
At MM, we send alerts when we are taking action on our own portfolio, it’s the simplest and more transparent approach we can take. In terms of ORE, we were very patient sending out the ORE alert on Friday watching the stock tumble throughout the session and simply only thought the selling was starting to show signs of abating nearing the close. While we’re sorry for the late alert, markets are fluid and we send alerts when we are buying, and that’s the time we were buying! We tend to get emails like this when we are transacting in more volatile stocks – it’s more challenging to pick levels. ORE is a high risk, volatile stock that moves a lot as was the case on Friday.
In hindsight, the email alert was hitting inboxes within minutes of the low following an 11% intra-day drop. Text alerts unfortunately are not always as fast due to various carriers, phone reception etc. and we are currently working on an exciting workaround for this that should make communications with our subscribers seamless.
Orocobre (ORE) Monthly Chart
Question 6
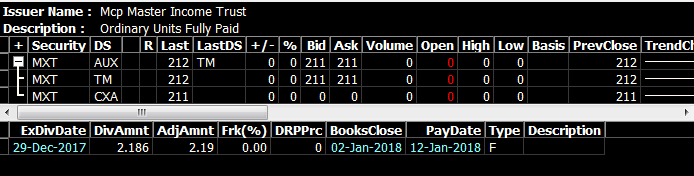
“Hi James, what is your view on MXT? what price level should we sell it? also I am not clear about its monthly distribution rule- do we need hold a certain days before distribution to entitle the distribution or not? and does its distribution reduce its share price same as normal listed company dividend?” – Best wishes Michael S.
Morning Michael, MXT pays quarterly distributions the same as a stock may pay dividends. We need to own units in the trust the day before it goes ex-distribution, the same as buying a stock the day before the ex-dividend date. Given the distributions are unfranked, no holding periods apply for franking. The distribution would theoretically reduce the trust price by that amount.
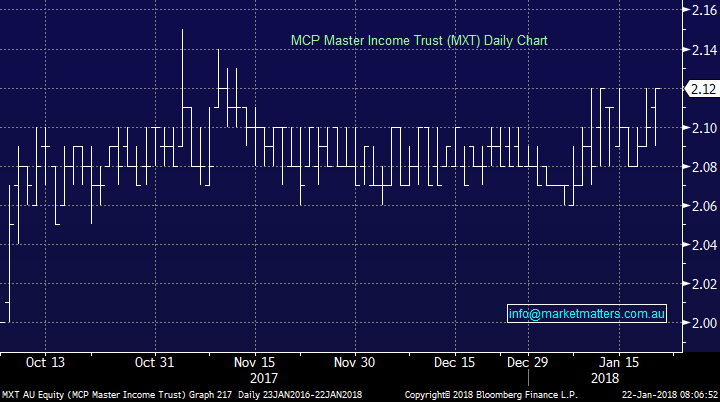
As per prior comments, we think $2.15 is rich for this security and we may sell our holding there.
MCP Master Income Trust (MXT) Daily Chart
Overnight Market Matters Wrap
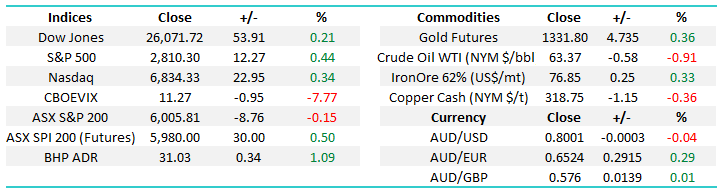
· The US equity indices closed in record territory last Friday, however uncertainty looms with the current shutdown of the US government over the weekend.
· US reporting season has started in strong fashion with 75% surprising positively. A lot of the recent equities rally can be explained by strong earnings rather than PE expansion.
· Copper and aluminium fell, while nickel rallied on the LME. Oil fell, while gold and iron ore were better.
· The March SPI Futures is indicating the ASX 200 to open 30 points higher towards the 6135 area this morning.
Disclosure
Market Matters may hold stocks mentioned in this report. Subscribers can view a full list of holdings on the website by clicking here. Positions are updated each Friday, or after the session when positions are traded.
Disclaimer
All figures contained from sources believed to be accurate. Market Matters does not make any representation of warranty as to the accuracy of the figures and disclaims any liability resulting from any inaccuracy. Prices as at 22/1/2018. 8.00AM.
Reports and other documents published on this website and email (‘Reports’) are authored by Market Matters and the reports represent the views of Market Matters. The MarketMatters Report is based on technical analysis of companies, commodities and the market in general. Technical analysis focuses on interpreting charts and other data to determine what the market sentiment about a particular financial product is, or will be. Unlike fundamental analysis, it does not involve a detailed review of the company’s financial position.
The Reports contain general, as opposed to personal, advice. That means they are prepared for multiple distributions without consideration of your investment objectives, financial situation and needs (‘Personal Circumstances’). Accordingly, any advice given is not a recommendation that a particular course of action is suitable for you and the advice is therefore not to be acted on as investment advice. You must assess whether or not any advice is appropriate for your Personal Circumstances before making any investment decisions. You can either make this assessment yourself, or if you require a personal recommendation, you can seek the assistance of a financial advisor. Market Matters or its author(s) accepts no responsibility for any losses or damages resulting from decisions made from or because of information within this publication. Investing and trading in financial products are always risky, so you should do your own research before buying or selling a financial product.
The Reports are published by Market Matters in good faith based on the facts known to it at the time of their preparation and do not purport to contain all relevant information with respect to the financial products to which they relate. Although the Reports are based on information obtained from sources believed to be reliable, Market Matters does not make any representation or warranty that they are accurate, complete or up to date and Market Matters accepts no obligation to correct or update the information or opinions in the Reports.
If you rely on a Report, you do so at your own risk. Any projections are estimates only and may not be realised in the future. Except to the extent that liability under any law cannot be excluded, Market Matters disclaims liability for all loss or damage arising as a result of any opinion, advice, recommendation, representation or information expressly or impliedly published in or in relation to this report notwithstanding any error or omission including negligence.
To unsubscribe. Click Here