Hi SK,
Three questions here, and we’ve spent more time on the first one;
Market valuation: the article says that stock prices are way ahead of business fundamentals (earnings, assets)—a clear warning sign. We’re now in the “strongly overvalued” zone—the biggest bubble in my model’s history, exceeding even the Dot Com Bubble of 2000. It sights various examples of over valuation followed by crashes. We hate to use the term, this time is different, but it is. Every time is different! We’re not saying the market may not experience weakness, and there won’t be crashes again, but our observations are these:
- Comparing S&P 500 valuations in 1970 to today has little relevance. At that time, the S&P 500 was made up of 22% Industrials, 20% Staples and just 2% in Technology. Today, Technology makes up 30.7% of the S&P 50o while Industrials makes up 8.5% and Staples make up 6.3%. A technology company can scale a lot quicker and grow earnings faster than a staple or an industrial, and they should attract higher valuations. The S&P 500 should trade at a higher multiple today than then because the composition is a lot different.
- The article also sights assets as a measure, though, we would argue the definition of assets has also changed and how they are valued. i.e. more than just plant and equipment.
- The Dot Com Bubble is used however this was characterised by not only profitless tech, but tech not even producing a lot of revenue. The Tech today is a lot different to DotCom tech. Before the bubble burst, the S&P was on 30x earnings with tech making up 28% of the S&P. Today, tech makes up more and the index trades on 23x, and we’d argue the tech companies today are a lot bigger and more robust.
- Central banks and Governments have shown a greater willingness to act to avoid these sorts of meltdowns in recent years using unconventional monetary policy, which reduces the boom-and-bust nature of markets.
Ultimately, we think it’s too simplistic to compare past valuations using the same measure at the index level, because the index is simply so different today than it was in many of those examples. And further, we don’t think valuation is a reason for big meltdowns in isolation.
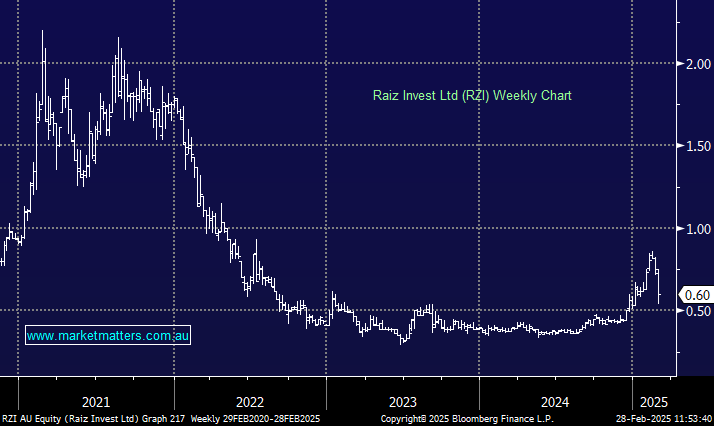
Raiz Invest(RZI): We do like the fractional investing aps, however Raiz is very small at a $63mn market cap with very low turnover, a low level of earnings, operating in a very competitive space.
GARP and QUAL ETFs traded on the ASX are very similar on balanced we prefer the QUAL, just, due to its sheer size but the costs are slightly higher. In line with comments above we could happily buy either into dips.
- QUAL expense ratio is 0.4% and total assets of $7.3bn compared to the GARP ETF with $22mn and costs of 0.3%.