The “FANG” stocks are leading the wobbles on Wall Street
The ASX200 has enjoyed an excellent rebound over the last 2-days rallying over 1.5% from Wednesday’s panic low. However, while it was fairly easy to foresee the buying of weakness its hard at this point to imagine fund managers chasing stocks higher as US stocks continue to throw out warning signals.
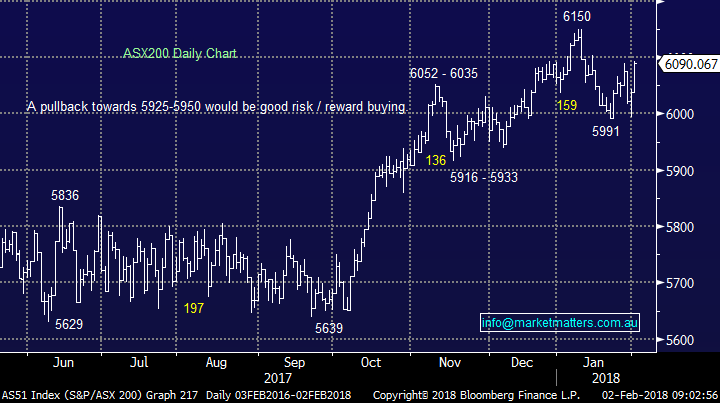
Subscribers should remember that our target for this pullback is around the 5925-5950 area for the ASX200, the market is set to open close to 6070 this morning i.e. over 2% above our current optimum buy zone.
We are still sitting on 17.5% cash in our Growth Portfolio which feels about right at today’s levels, especially with the highly correlated European stocks remaining under short-term pressure.
Today’s report has focused on the FANG stocks which led US stocks higher in an attempt to get an idea whether it’s time to become concerned with the state of equity markets medium-term i.e. Facebook, APPLE, Amazon, Netflix and Google.
ASX200 Daily Chart
US Markets
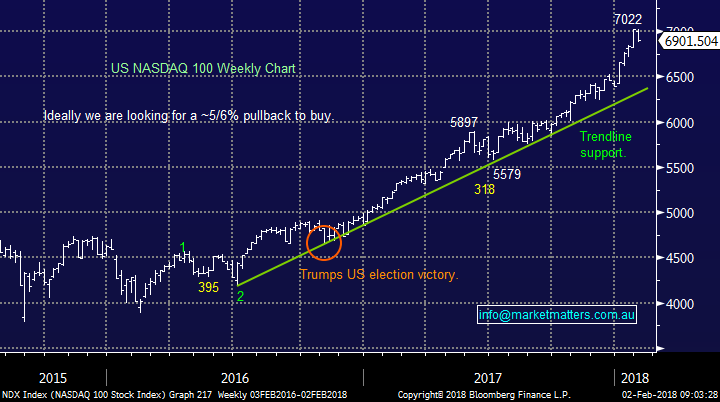
A quick glance at the tech NASADAQ index shows that the last few days apparent volatility is hardly a blip on the radar, we have closed this morning less than 2% below the all-time high posted late last week. In 2018 the advance-decline ratio of stocks has shown us a market advancing on decreasing breath which is usually a warning sign of deteriorating strength and a looming correction, obviously time will tell but statistically it is overdue as regular readers would certainly be aware!
To test the impressive uptrend since the US election we have to see a correction of another ~6% for the index.
Nasdaq 100 Weekly Chart
Interest Rates
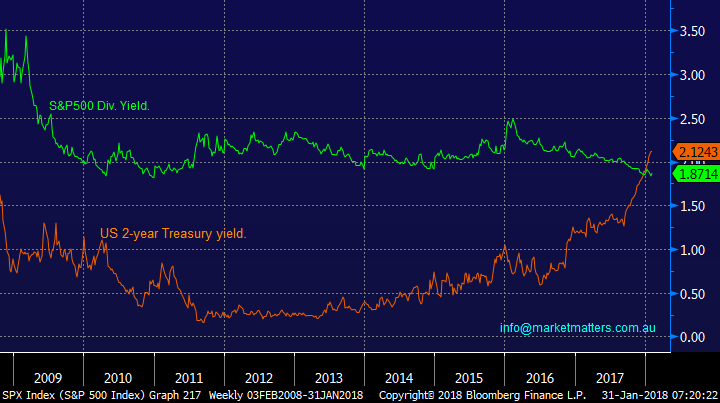
The straw that appears to have broken the back of US stocks over recent days has been the big elephant in the room – interest rates. US Treasury 2-year yields reached 2.169% last night, their highest level since September 2008 while the 10 year yield in the US hit 2.78% overnight, and interestingly, is now inline with the Aussie 10 year bond yield.
Risk free US Treasuries are suddenly paying investors more than relatively expensive stocks and we are hearing noises that investors are re-evaluating which side of the fence they should be sitting.
Comparison of US stocks and 2-year bond yields.
Volatility
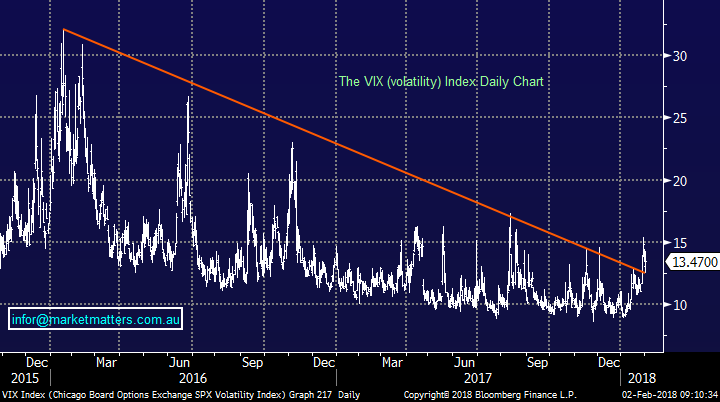
The Fear Index / Volatility (VIX) has been in a clear downtrend since the Dow’s major swing low in 2015, from where its rallied over 70%. However, over the last few weeks this has clearly been broken implying to us the strong possibility of a rally to the recent 20% resistance area, which in itself implies US stocks have further to fall – as Sherlock Holmes said “ The game is afoot!”
Remember one of MM’s views for 2018 was increased volatility as interest rates rise, which has clearly played out to-date.
Fear Index (VIX) Daily Chart.
1 Facebook
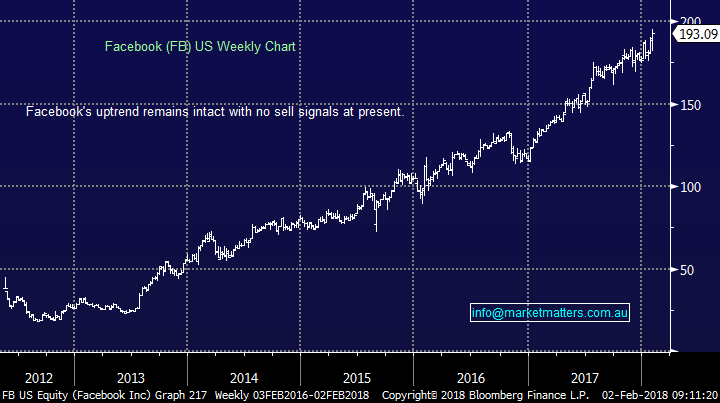
Facebook has been rallying since late 2012 but we noted in this week’s report the reduced user time on the social media site. We like the concept of Mark Zuckerberg around quality not quantity on Facebook but question how good will that view be for advertising for revenue? T
There are currently no sell signals in FB, however if we were long, we’d be reducing our exposure at current levels
Facebook (FB) US Weekly Chart
2 APPLE Inc (US)
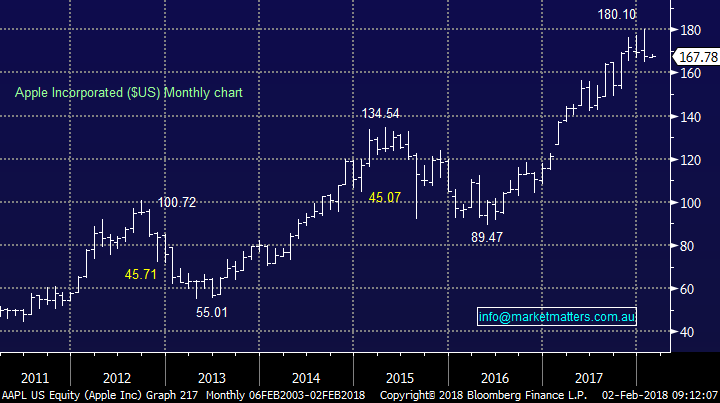
Market heavyweight APPLE has corrected ~7% from Januarys high and looks very tired at current levels. They reported overnight and the stocks is trading marginally higher in afterhours trade after being down initially. They have guided to 2Q revenue of between $60-62bn versus the $65.88b estimated by the market) which is obviously a slight miss, while their iPhone sales were huge in Q1 at 77.3 million units, however that was a slight miss on the 80.2m expected.
A big call, however we can see APPLE trading 15-20% lower over 2018/9.
APPLE Inc (US) Monthly Chart
3 Amazon.Com (US)
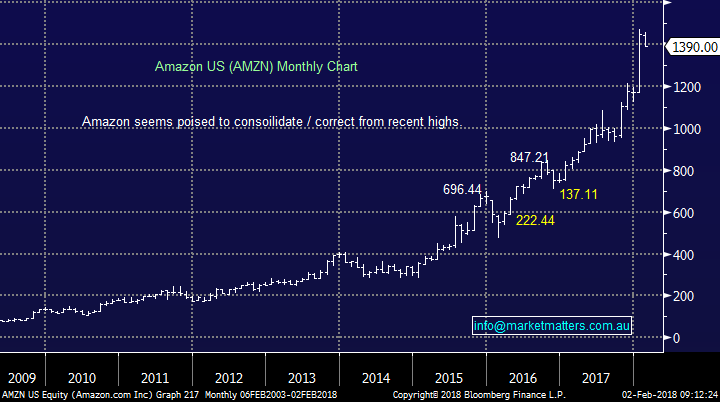
Amazon has corrected 5.5% this week pre-results, however they have just reported Q1 numbers and the stocks has rebounded by 5.6% in post market trade. Heightened volatility is a sign of a shorter term top and we expect Amazon to trade lower in the nearer term, and would only get interested on a pullback of ~10%.
Hence, we feel investors looking to go buy this online goliath should be patient short-term.
Amazon US Monthly Chart
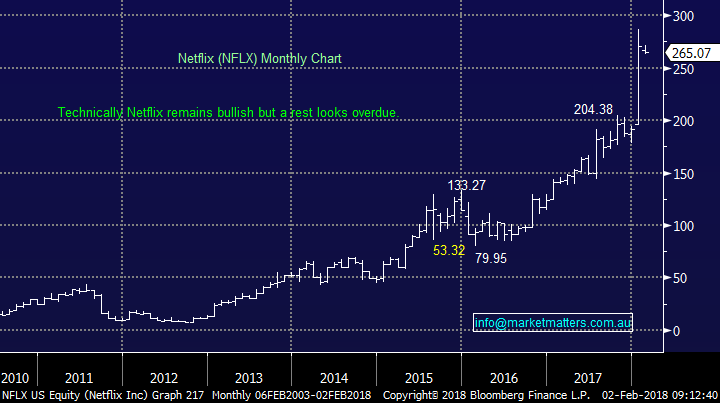
4 Netflix US
Netflix has an amazing run with increasing users and rising revenue per user – a recipe for success. Some cracking shows on Netflix at the moment, with a huge (and growing) list of original content – Peaky Blinders very much worth a look. My kids simply don’t turn of free to air TV anymore!
So far, this week Netflix has corrected over 7%, at this stage we would not expect a great deal more.
Netflix (NFLX) Monthly Chart
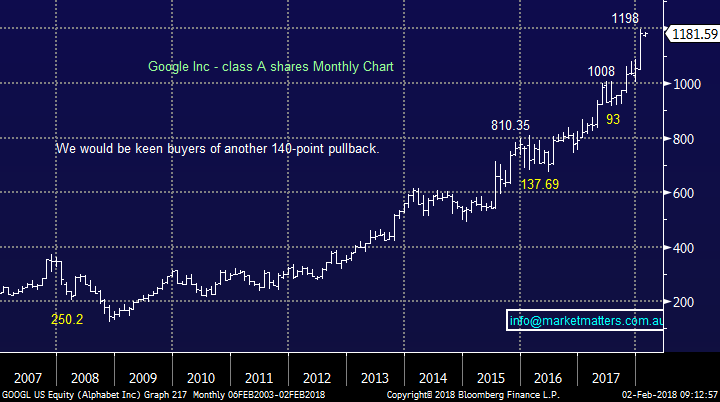
5 Google US
Google has corrected only 1.4% so far, we would be keen buyers around 1110, or 6% lower if weakness does unfold.
Google Inc – Class A Monthly Chart
Global Indices
US Stocks
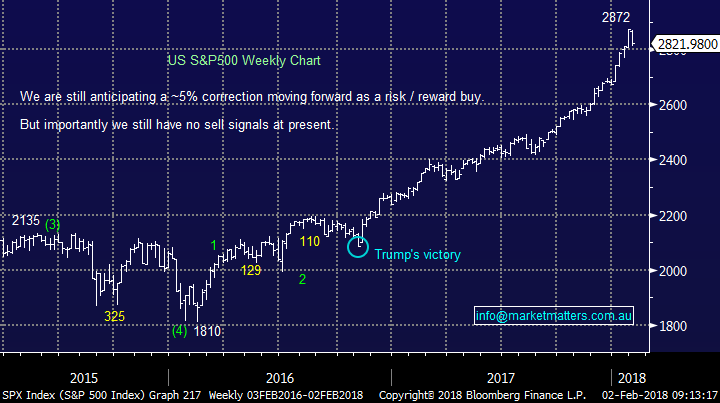
We have covered US equities in depth today but our target for the current weakness in the S&P500 is around 2780, or 1.5% lower.
US S&P500 Weekly Chart
European Stocks
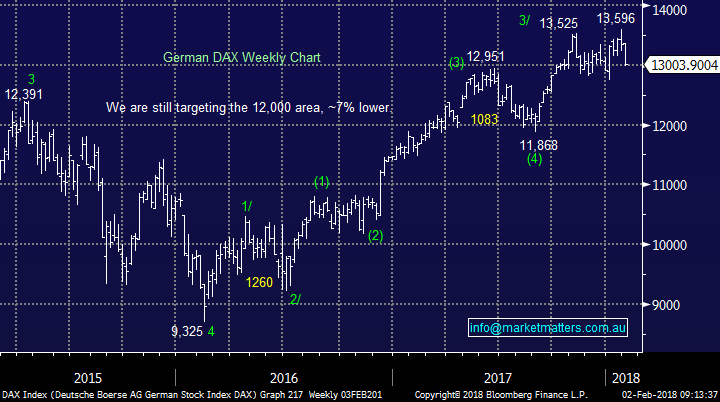
No major change with our preferred scenario for the German DAX a 7% correction back towards the 12,000 area for excellent risk/reward buying – this implies strongly that a global correction by stocks has further to unfold.
German DAX Weekly Chart
Conclusion (s)
We not surprisingly have a different opinion of the 5 FANG stocks covered today.
Our favourite buy is Google around 1110 while we see the most downside in APPLE.
Overnight Market Matters Wrap
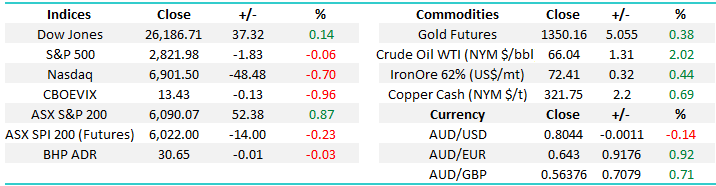
· The US equity markets closed mixed with little change as investors focused on the benchmark US 10-year bond yields, once again hitting 4-year highs of 2.76% on investor concerns of rising inflation spurring further rate hikes this year, with the first expected in March.
· US earnings continue with 80% of current reported companies beating analyst consensus.
· Commodities were mixed with oil rebounding from recent weakness with the price of Brent crude up 1% at US$69.50, iron ore and base metals steady. Both BHP and RIO are trading about 0.5% up in US trading and the A$ is slightly weaker at US80.3c.
· The March SPI Futures is indicating the ASX 200 to open 9 points lower towards the 6080 level this morning.
Disclosure
Market Matters may hold stocks mentioned in this report. Subscribers can view a full list of holdings on the website by clicking here. Positions are updated each Friday, or after the session when positions are traded.
Disclaimer
All figures contained from sources believed to be accurate. Market Matters does not make any representation of warranty as to the accuracy of the figures and disclaims any liability resulting from any inaccuracy. Prices as at 02/02/2018. 8.00AM.
Reports and other documents published on this website and email (‘Reports’) are authored by Market Matters and the reports represent the views of Market Matters. The MarketMatters Report is based on technical analysis of companies, commodities and the market in general. Technical analysis focuses on interpreting charts and other data to determine what the market sentiment about a particular financial product is, or will be. Unlike fundamental analysis, it does not involve a detailed review of the company’s financial position.
The Reports contain general, as opposed to personal, advice. That means they are prepared for multiple distributions without consideration of your investment objectives, financial situation and needs (‘Personal Circumstances’). Accordingly, any advice given is not a recommendation that a particular course of action is suitable for you and the advice is therefore not to be acted on as investment advice. You must assess whether or not any advice is appropriate for your Personal Circumstances before making any investment decisions. You can either make this assessment yourself, or if you require a personal recommendation, you can seek the assistance of a financial advisor. Market Matters or its author(s) accepts no responsibility for any losses or damages resulting from decisions made from or because of information within this publication. Investing and trading in financial products are always risky, so you should do your own research before buying or selling a financial product.
The Reports are published by Market Matters in good faith based on the facts known to it at the time of their preparation and do not purport to contain all relevant information with respect to the financial products to which they relate. Although the Reports are based on information obtained from sources believed to be reliable, Market Matters does not make any representation or warranty that they are accurate, complete or up to date and Market Matters accepts no obligation to correct or update the information or opinions in the Reports.
If you rely on a Report, you do so at your own risk. Any projections are estimates only and may not be realised in the future. Except to the extent that liability under any law cannot be excluded, Market Matters disclaims liability for all loss or damage arising as a result of any opinion, advice, recommendation, representation or information expressly or impliedly published in or in relation to this report notwithstanding any error or omission including negligence.
To unsubscribe. Click Here