Is this the Calm Before the Storm?
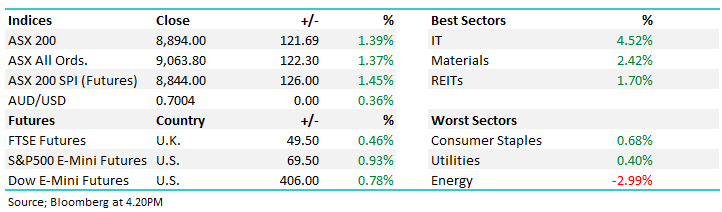
The ASX200 had an excellent day yesterday, ignoring a 250-point fall on Wall Street to post small gains with our banking sector finally finding a little love and gaining +0.2%. The domestic reporting season again threw up some surprises in both directions with heavyweight BHP falling -4.8% while A2 Milk soared almost +30%, unfortunately we got off that express train too soon – importantly MM is never too proud to rebuy back into a stock at higher prices if we believe the underlying reasons / value to own the stock have evolved, we are about making money in a prudent risk / reward fashion not standing on a soap box telling everybody how correct we were.
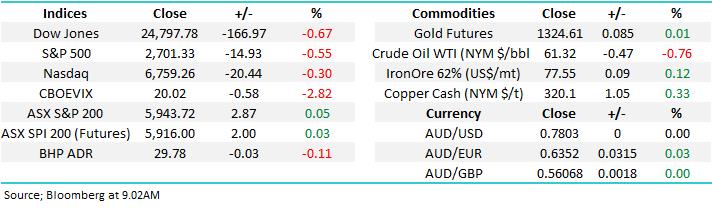
While I start typing this morning, the Dow is up around 50-points after surrendering an impressive 250-point advance following the Fed’s minutes – overall the Fed was positive on the US economy but this pushed bond yields higher stopping the advancing equities in their tracks with noticeable weakness in the Real Estate and Utilities i.e. the “yield play” sector. Our “gut feel” is equities are trying to rally after the recent aggressive tantrum with the US NASDAQ trading within 2% of its all-time high this morning. The Dow has finally closed down 167-points but interestingly the ASX200 SPI futures are pointing to slightly positive opening by local stocks, were running our own race at present and if anything it felt like traders were buying our market last night and selling the US.
Over the last 24 hours a lot of air play has been given to article by US powerhouse Morgan Stanley saying “The stock slide was an appetizer for the real deal” certainly a title to scare many investors. The crux of their thought process is the looming damage that rising bond yields will have on stock prices. We liked a lot of their reasoning and will today revisit our view for the next few months, what we believe will be the most important period for stock market investors since the GFC.
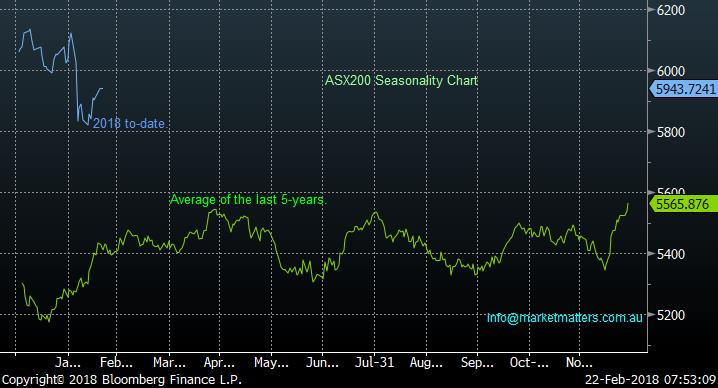
At MM we are becoming increasingly confident that the Q1 low is in place for global stocks with a rally into April / May our preferred scenario – don’t argue with strong seasonal statistics! – Please enjoy today’s report outlining / explaining our current thought processes.
Local Index
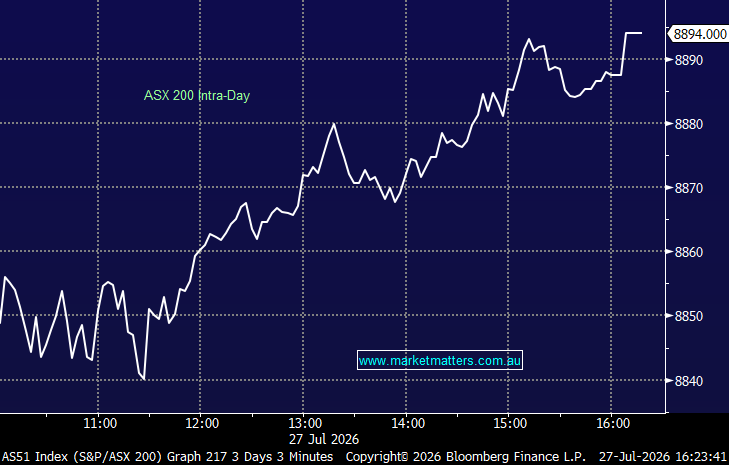
Yesterday’s the ASX200 closed basically unchanged after yet again rallying for most of the day and closing very near its high. Overall the local market looks constructive and when we bore into its solid advance from its recent panic lows, for the active trader we would be a buyer of any +60-point correction.
However we still need a decent close above the psychological 6000 level to become technically bullish targeting ~6250.
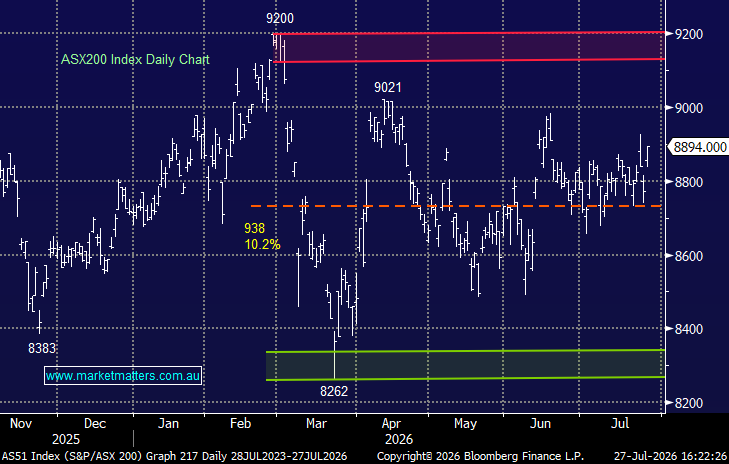
ASX200 Daily Chart
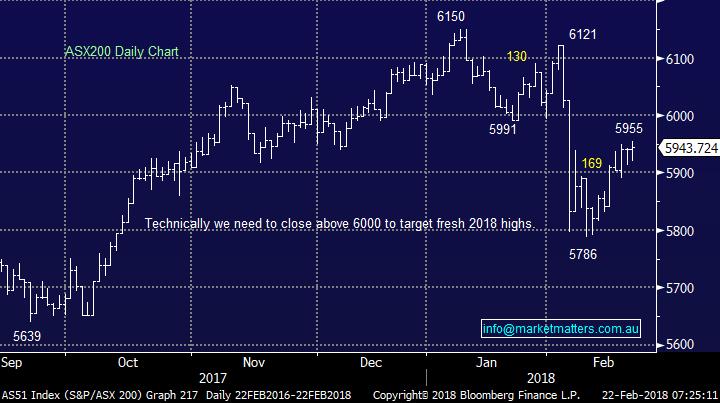
We have discussed at length our reasoning logic behind the forecast of a decent swing low in early February with the 5786 point reached on the 9th looking the goods at present but what usually comes next if we are correct is rapidly becoming important. Since the GFC:
1. The average rally from the Q1 swing low into an April / May high is 450-points which targets 6235, assuming 5786 holds – not an unrealistic target if the banks come back into favour i.e. up less than 5% from current levels.
2. The market forms a swing high between April and May with no clear pin point target implying slow selling into strength makes sense.
Hence until further notice we will stay long local stocks looking to significantly increase cash levels into April / May.
ASX200 Seasonality Chart
US Stocks & interest rates
Again this morning a couple of points caught our attention from the US market last night / this morning:
1. The tech. loaded NASDAQ Index traded within 2% of its all-time high last night, we can eventually see another 10% upside. – At MM we often say the NASDAQ is usually the “leading index”.
2. However short-term we think the +11.6% advance from the panic lows on the 9th is probably complete and a few days / weeks weakness, or consolidation, is our preferred scenario.
US NASDAQ Weekly Chart
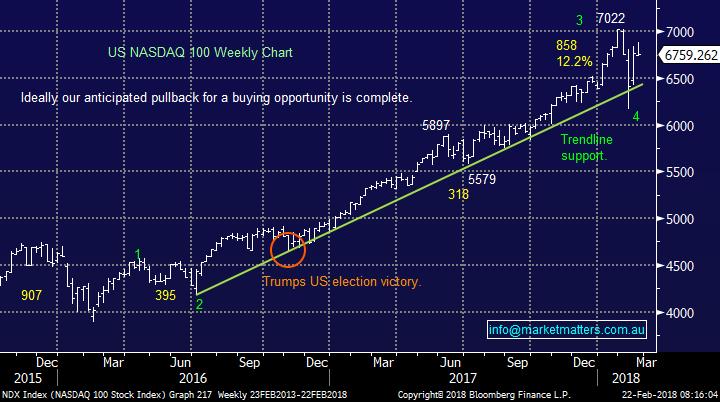
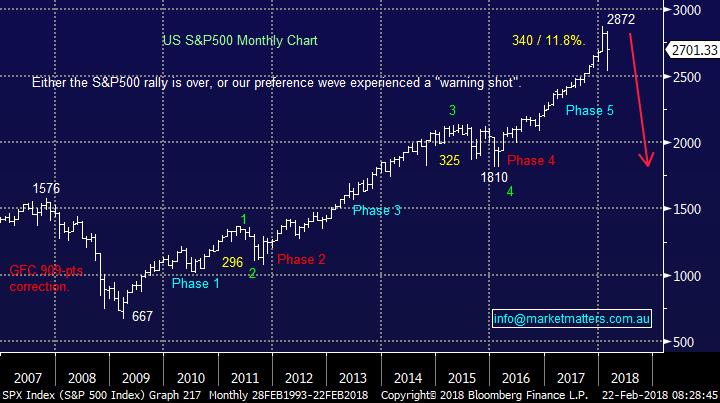
Subscribers must remember our longer-term view that stocks are getting ready for a meaningful +20% correction – a fantastic opportunity for the prepared!
US S&P500 Monthly Chart
Following the Fed's optimistic minutes last night US bond yields rallied to multi-year highs, this is an advance that we believe has much further to go e.g. US 2-year bond yields look likely to hit ~3% in 2018/9.
As we have seen over the last week, strengthening US bond yields is slowly dragging the $US higher and this should be taken into account when structuring local portfolio’s moving forward i.e. the $A has already fallen from 81.3c to 78c.
US 2-year bond yields Monthly Chart

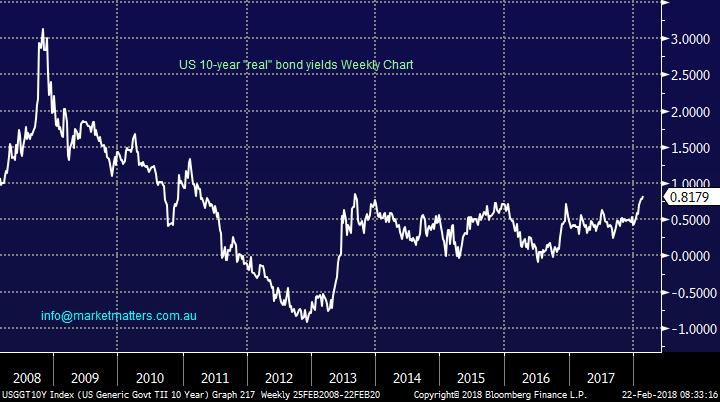
One chart / point that Morgan Stanley looked at in their piece discussing the “calm before the storm” was real US 10-year bond yields i.e. inflation adjusted bonds.
Clearly these are still range bound although in our opinion it’s a matter of time before real bond yields break higher, this could easily be a catalyst to send equities lower hence its now firmly on our radar.
US 10-year “real” bond yields Weekly Chart
Conclusion
We remain bullish stocks into April / May, but be prepared for increasing volatility as market looks for a top.
Watch for alerts
Global markets
US Indices
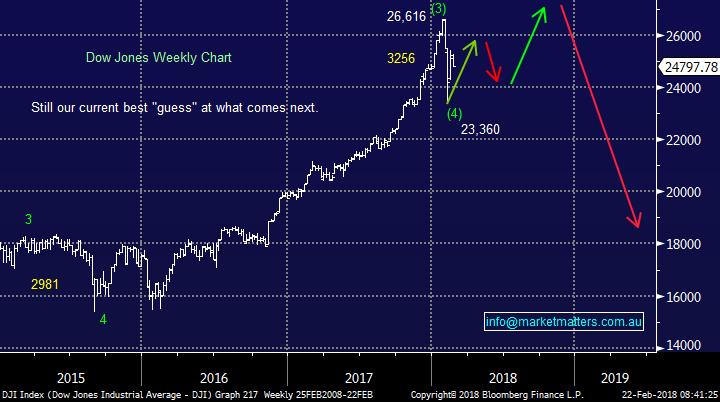
No major change from yesterday, overall we believe US stocks have formed a low and they will be higher in 1-2 months’ time.
• While we expect US stocks to rally to fresh highs the likely manner of the advance is far more choppy / indecisive than the almost exponential gains we have witnessed from late 2016.
Similar to both 2010 and 2014 we believe that US stocks have given the market a relatively friendly warning recently – a nudge around what could be on the horizon. At this point in time I expect investors to slowly forget the recent volatility and refocus on all the bullish fundamental reasons to be in stocks ideally pushing global markets back up to fresh all-time highs before buying the next dip will become very dangerous. MM view from here:
1. Global markets are likely to regain their bullish euphoric mood through February / March and push prices back to all-time highs.
2. Following later in 2018/9 will be a ~20% correction back to the lows of 2016 i.e. hence our recent buying is relatively short-term in nature.
US Dow Jones Weekly Chart
European Stocks
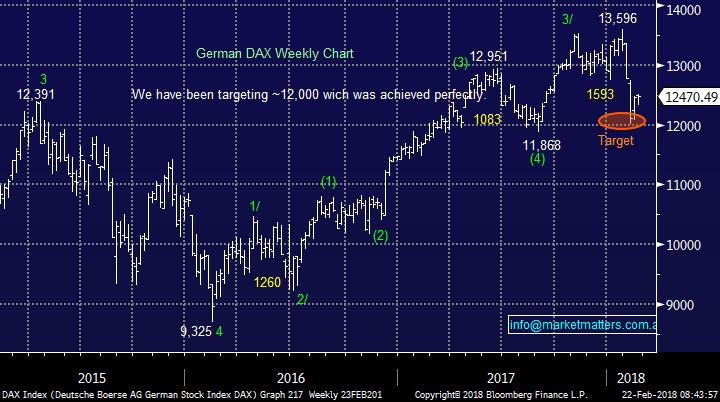
European stocks made fresh recent lows this week as expected, our preferred scenario is now a rally back over 13,000 by the German DAX to fresh all-time highs in 2018 for an excellent selling opportunity.
German DAX Weekly Chart
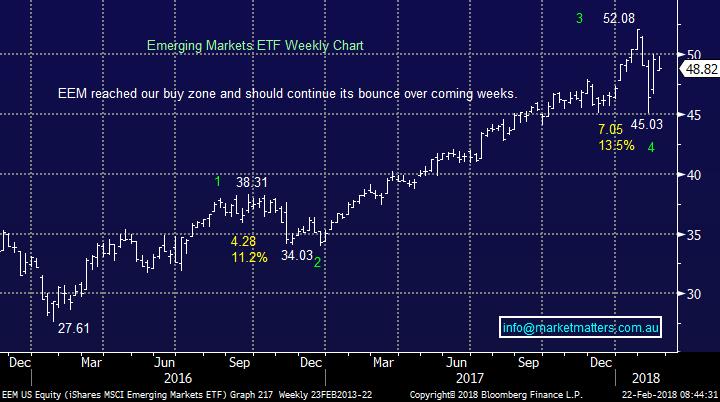
The Emerging Markets Index is unfolding as anticipated and a few more weeks around this 48-50 area would be ideal before a pop up towards our 55 target area.
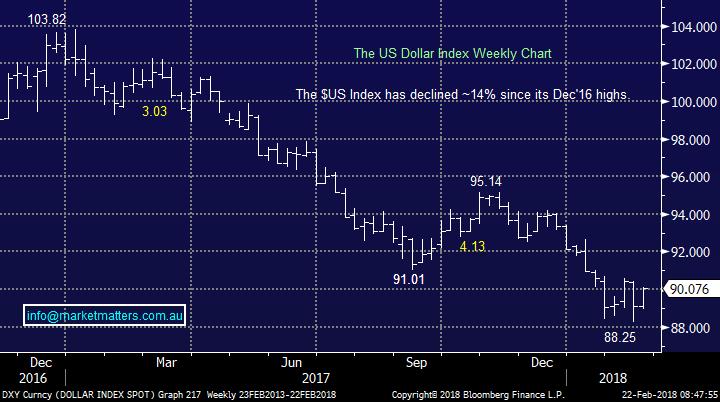
Our local resources are very highly correlated to the EEM so we remain comfortable with recent foray into the likes of RIO and Oz Minerals but remain wary of the inversely correlated $US Index which is now 50-50 to us i.e. has it bottomed or will we see a final spike down towards 87.
Emerging Markets (EEM) Weekly Chart
$US Index Weekly Chart
Overnight Market Matters Wrap
• US equities reversed strong gains after the Federal Reserve released meeting minutes from late January that showed increasing confidence in the economy.
• A number of analysts upgraded their price targets for “FAANG” stocks, but that wasn’t enough to stop the NASDAQ from also closing in the red.
• The US 10 year Treasury yield rose to 2.95% as US Fed officials noted economic growth may exceed their estimates.
• Copper, aluminium and nickel advanced on the LME, while oil was slightly weaker. Iron ore remains untraded.
• The March SPI Futures indicating the ASX 200 to open 14 points higher towards the 5958 area this morning.
Disclosure
Market Matters may hold stocks mentioned in this report. Subscribers can view a full list of holdings on the website by clicking here. Positions are updated each Friday, or after the session when positions are traded.
Disclaimer
All figures contained from sources believed to be accurate. Market Matters does not make any representation of warranty as to the accuracy of the figures and disclaims any liability resulting from any inaccuracy. Prices as at 22/02/2018. 9.02AM
Reports and other documents published on this website and email (‘Reports’) are authored by Market Matters and the reports represent the views of Market Matters. The MarketMatters Report is based on technical analysis of companies, commodities and the market in general. Technical analysis focuses on interpreting charts and other data to determine what the market sentiment about a particular financial product is, or will be. Unlike fundamental analysis, it does not involve a detailed review of the company’s financial position.
The Reports contain general, as opposed to personal, advice. That means they are prepared for multiple distributions without consideration of your investment objectives, financial situation and needs (‘Personal Circumstances’). Accordingly, any advice given is not a recommendation that a particular course of action is suitable for you and the advice is therefore not to be acted on as investment advice. You must assess whether or not any advice is appropriate for your Personal Circumstances before making any investment decisions. You can either make this assessment yourself, or if you require a personal recommendation, you can seek the assistance of a financial advisor. Market Matters or its author(s) accepts no responsibility for any losses or damages resulting from decisions made from or because of information within this publication. Investing and trading in financial products are always risky, so you should do your own research before buying or selling a financial product.
The Reports are published by Market Matters in good faith based on the facts known to it at the time of their preparation and do not purport to contain all relevant information with respect to the financial products to which they relate. Although the Reports are based on information obtained from sources believed to be reliable, Market Matters does not make any representation or warranty that they are accurate, complete or up to date and Market Matters accepts no obligation to correct or update the information or opinions in the Reports.
If you rely on a Report, you do so at your own risk. Any projections are estimates only and may not be realised in the future. Except to the extent that liability under any law cannot be excluded, Market Matters disclaims liability for all loss or damage arising as a result of any opinion, advice, recommendation, representation or information expressly or impliedly published in or in relation to this report notwithstanding any error or omission including negligence.
To unsubscribe. Click Here