Subscriber questions (CUV, CSL, Z1P, KDR, ATL, ORI, NAB, MYR)

The ASX200 should open up around 15-points this morning helped by BHP’s ~1% advance in the US. No major market influencing news came across the wires this weekend although investors’ concerns around Labor’s $59bn dividend grab may dissipate a little after Labor failed in its attempt to win a 5th consecutive term in South Australia – all the concerns are gone if Malcolm Turnbull wins the next federal election before May 2019!
In other news, the Sea Eagles walloped Parramatta on a very hot Sunday afternoon at Brookvale Oval – we (Shaw and Partners) sponsor the Sea Eagles and I took a dozen clients to the game. Go the Eagles!

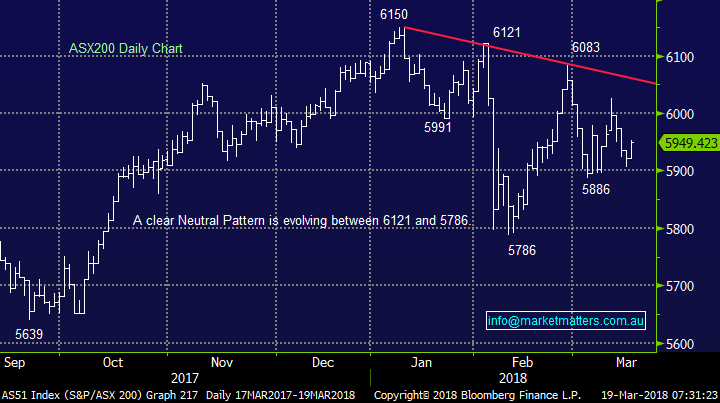
Back the markets, and we still need a close by the ASX200 above 6030 to regain our bullish technical stance targeting 6250-6300 in March / April, less than 1% where we are likely to open this morning.
Our view at MM remains Februarys aggressive sell-off by global equities is the warning sign we have anticipated for what will follow over the coming years but the time to jump off the stock market train has not arrived, just yet.
ASX200 Chart
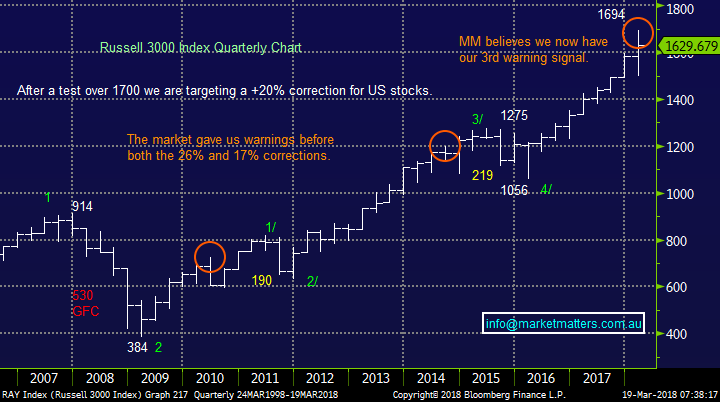
The US market gave us little lead last week as it chops around less than 4% below its all-time high - certainly in striking distance.
- Ideally US stocks will see one final high in the coming weeks before we will significantly increase our cash position.
US Russell 3000 Chart
This week we have again received a great group of questions which addresses some excellent topics / issues. Today I have answered 11 of them.
Question 1
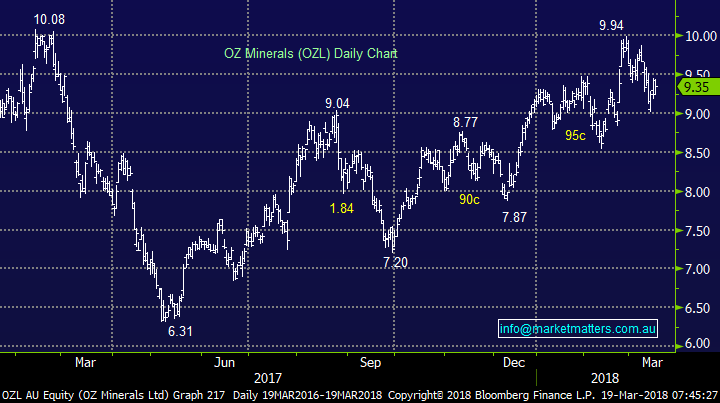
“Hi MM, we consider OZL as being one of the better Australian mining companies and we see the 12 month share price with a steadily increasing gradient. But we do wonder why the share price does not have the major variations that others (such as BHP) have, and if it will ever reach the levels of 2010 and 2008. Do you have target for OZL now and also later this year?” - Regards, Phil B.
Morning Phil, we own OZL with a target of ~$10 and think it’s an extremely big ask at this stage for OZL to look at its pre-GFC levels of +$30. BHP is still ~$17 below its comparative high.
The stock has rallied almost 5x from its post GFC lows which is huge. I’m not sure what you mean with regard to major variations as OZL is far more volatile than BHP e.g. in February it had a 15.6% range compared to BHP’s at only 9.1%.
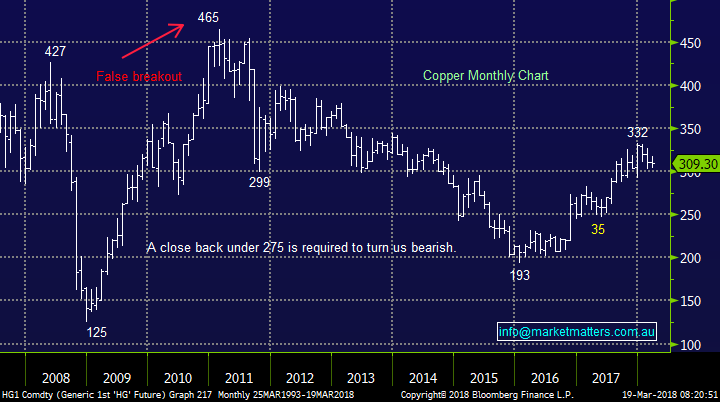
For OZL to kick well over $10 is probably going to need to rally significantly higher copper, which feels unlikely to us at present.
OZ Minerals (OZL) Chart
Copper Chart
Question 2
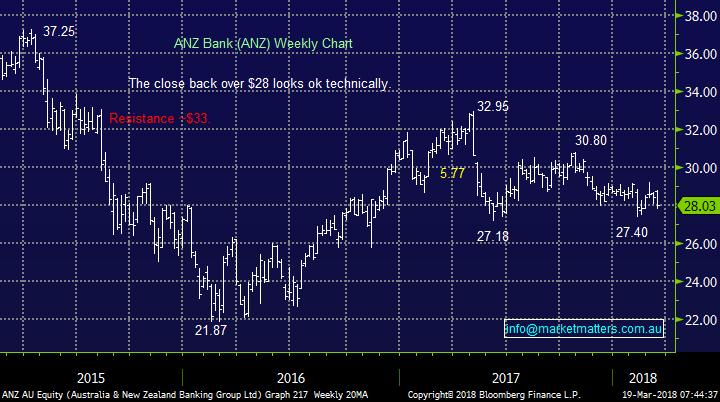
“Hi Market Matters team, I am curious why ANZ doesn’t get a mention in your commentary. According to my software it goes ex div around 8th of May and at current levels looking at 7.4% yield. I would of thought this was Impetus enough to command a bullish view. Why is there no inclusion to ANZ the big 4 summary?” - Cheers, Mark W.
Morning Mark, Bloomberg Consensus has ANZ paying 5.82% which when grossed up goes to 8.31% and as you rightly say the bank is due to go ex-dividend early in May.
We have mentioned that MM feels the “big 4” are the closest from a valuation perspective in many years, hence if we like CBA and NAB the same basically does holds true for ANZ and Westpac. Over the last 10-years ANZ has rallied on average +6.74% in March / April before weakening -6.69% in May / June, very comparable numbers to CBA, NAB and WBC. Generally we prefer CBA because its share premium to its piers has largely been removed and NAB is paying by far the highest yield but our feelings are basically the same towards ANZ, so sorry for lack of commentary! We are buyers of weakness during the Banking Royal Commission but wary of our medium term bearish view for stocks.
ANZ Bank (ANZ) Chart
Question 3
“ "The continued weakness and the failed break of 6000 that occurred on Monday has us questioning our bullish call for the short term." I can't understand why you haven't seen this earlier with the ASX200 constantly hitting lower highs!” – Thanks Glenn W.
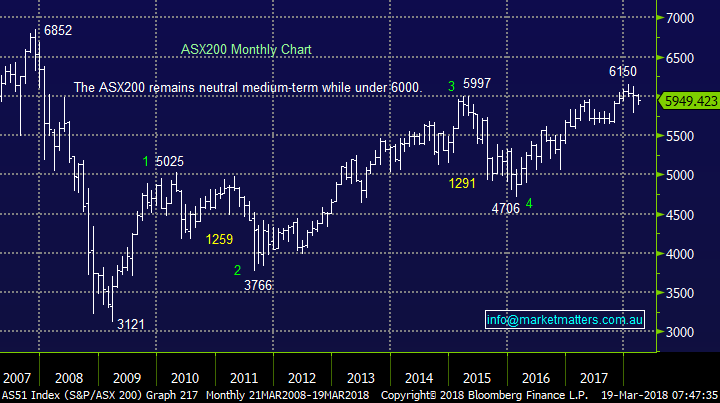
Morning Glenn, When we stand back and look at the market on a longer term basis I think there remains a strong possibility of fresh highs in 2018 but we feel a major top is nigh. The important points are:
- We aggressively sold the 2015 high and bought the 2016 low.
- We intend to aggressively sell a high in 2018 – we only hold 11.7% cash in the MM Growth Portfolio today.
Hence we are refraining from taking many / any short-term buying opportunities because we are in sell mode looking to significantly increase our cash position. I can see what you are looking at but short-term price action regularly contains more “noise” than the longer-term…….the ASX200 is struggling primarily due to the Royal Banking Commission which may be enough to stop our market enjoying its usually strong March / April, time will obviously tell.
Overall in the short-term we believe the ASX200 is trading in a neutral / choppy manner between 5786 and 6121 with no clear signs just yet but I think it will show its hand soon.
ASX200 Chart
ASX100 Accumulation Index Chart

Question 4
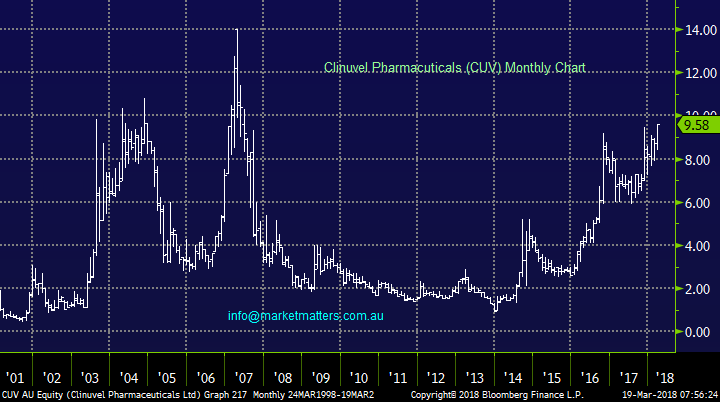
“Hi MM, Came across this stock recently, Clinuvel Pharmaceuticals (CUV). Intrinsic value is forecasted to grow to $28.43 and $56.18 next two years from $9.100 today. Appreciate your thoughts on this. Thanks.” – Regards Lakshan R.
Morning Lakshan, CUV is a Australian biopharmaceutical company which focuses on dermatology products primarily towards the UV area – undoubtedly a growth area. The company has a market cap. of $457M making it a real player following its strong price appreciation over the last 5-years.
We do not follow the stock closely so we can only comment technically:
- CUV looks bullish with stops now below $9.
Clinuvel Pharmaceuticals (CUV) Chart
Question 5
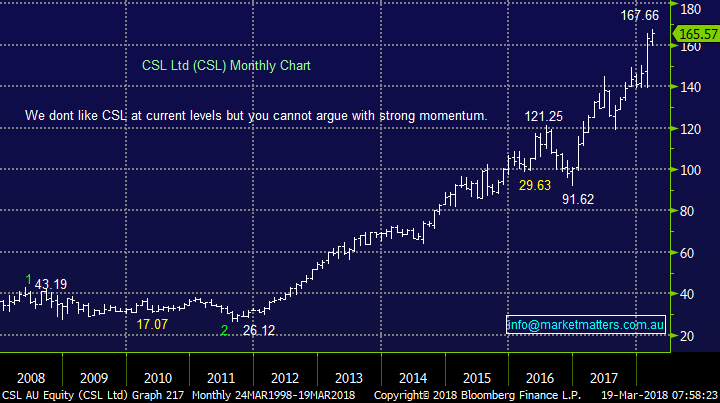
“ James, I am interested in your view on CSL. I noticed you don't have them in your portfolios. I would think if you had them at a good price it would be time to take some profit? Thanks Anne N.
Morning Anne, We made money in CSL last year but left way too much on the table so selling this quality company is not our strong-point to-date!
We like CSL and are awaiting a decent risk / reward buying opportunity but it feels expensive over $160. Hence at current levels we are neutral e.g. disliking high valuation stocks in an increasing interest rate environment but liking companies with good $US earnings at least for 12-months.
CSL Ltd (CSL) Chart
Question 6
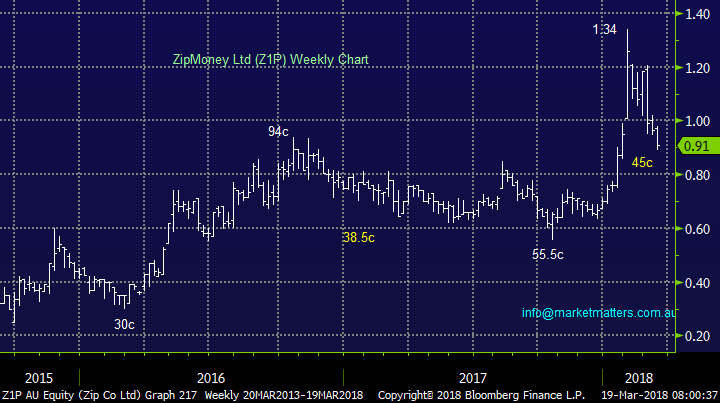
“Hi Guys, Z1P is now down to 91c. Back in the attractive range yet?” – Cheers Rob M.
Morning Rob, as you know we have not mentioned Z1P for a few weeks, except in last Mondays report, primarily because its price action has felt “wrong”.
- We could technically buy Z1P around 90c with stops under 80c but we will not be partaking.
ZIP Money (Z1P) Chart
Question 7
“Hi team, Just wanted to say I really enjoy your coverage and have been following it for the past year or so with success. I would like to flag one issue though. Yesterday you issued a SELL of KDR around $2.25 at about 1:34pm. At that time is was trading around $2.27 but within 5 minutes it had dropped below $2.25, and it stayed under until close.
I'd like to understand why you aren't able to put an alert out earlier that says if stock XXX gets to XXX we will be in the market selling. It would give your readers time to load a conditional or limit sale, given most of us are not sitting in front of a screen trading all day. This isn't the first time I've missed a trade due to sudden price movements. There may be a reason why you wait until the last minute and would like to understand that.
Lastly, I'd appreciate some kind of follow up commentary or advice the next day when a situation occurs. In this morning’s mail you simply stated "Yesterday we sold KDR for a ~21% profit as it made fresh all-time highs." without any consideration or advice for those that missed your 5 minute trading window. Great that YOU made a 21% profit but what should I be doing with my holding now.” - Thanks Steven M.
Hi Steven, what you have mentioned is an issue that we are very aware of because markets have a knack of moving too fast at times! I would add a few thoughts that may help moving forward:
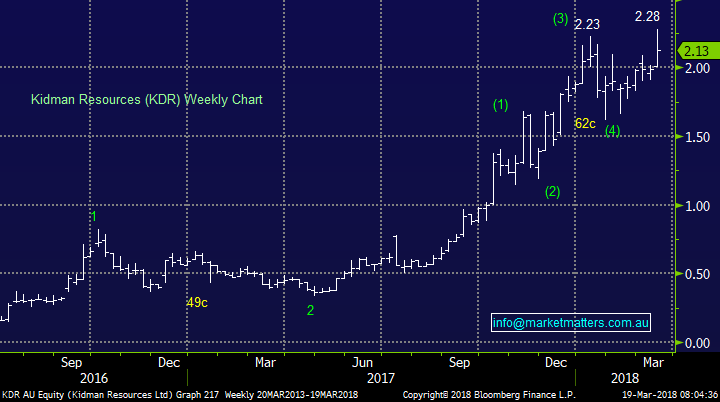
- We did flag our intention to sell KDR a number of times last week between $2.25 and $2.30, including in last Mondays questions.
- We would always say don’t hesitate to follow our alert within say 1% and there was plenty of opportunity to sell KDR on the day above $2.20.
- If in doubt on the day email / call MM.
- At this stage we think an opportunity to sell above $2.20 may well occur.
MM is sending a survey questionnaire to subscribers in the next few weeks as we look to improve our offering, an app to deliver messages and alerts is definitely a consideration – PLEASE complete the questionnaire so we can improve the service.
Kidman Resources (KDR) Chart
Question 8
“Good Afternoon at MM, May I please have your thoughts on Apollo Tourism (Ticker...ATL). I own the stock at the moment with a Buy @ $1.39 have already taken 25% Profit with the remaining still up 9% or so. The stock has retraced down to a RSI of 30 today at a price of $1.53 I`m thinking of buying back in hopefully at $1.50 or under ???
I am liking Market Matters and a big fan of James...Very refreshing to have someone like James that doesn’t sit on the fence. Good Job!!! Hope to hear back from you!” - Best regards, Scott P.
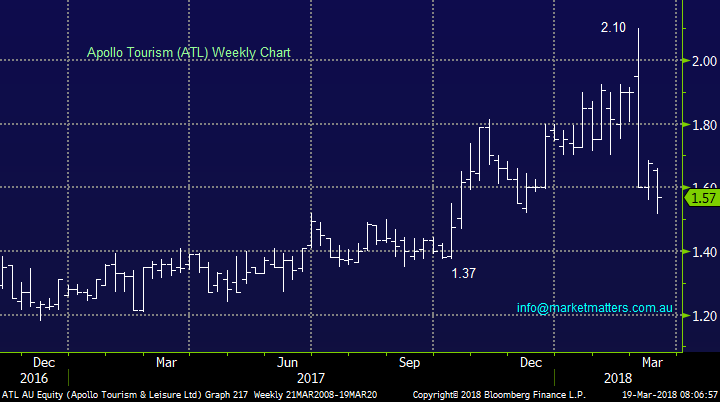
Hi Scott, thanks for the thumbs up! We are not close followers of ATL so I will simply add some technical comments:
- A bounce back towards $1.70 looks a strong possibility.
- Conversely a break under $1.50 would look very worrying.
Apollo Tourism (ATL) Chart
Question 9
“Two questions. We have ORI in our portfolio. It has a low yield of around 2.8%. Will it benefit from the rally in commodity prices from the current synchronised global growth phase? The second is sensitive. Are brokers influenced in recommending a stock because a Fund Manager pays large institutional commissions. Sorry, a touchy subject that has nothing to do with your organisations.” – Thanks John S.
Morning John,
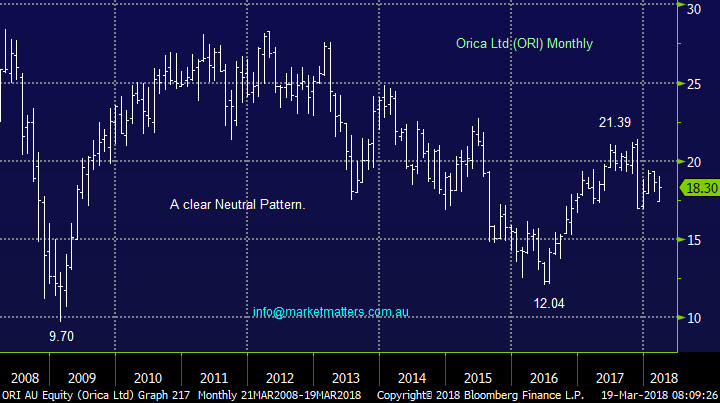
Firstly ORI being a diversified manufacturing company is correlated to global growth but not as directly to commodity prices as say BHP and RIO. However we have to remember that markets are forward looking hence a significant degree of global economic optimism is built into ORI at current levels. We are neutral ORI at present.
The second part is a good question, so need to apologise. In my opinion , brokers / analysts are not really skewed from institutional commissions but from corporate work that a broker may get / not get depending on their view of a stock. For example, a listed company is unlikely to use a broker to raise capital that has a negative view of the company in their latest research report. If brokers publish too many negative views / company reports, the pool of potential ‘customers’ reduces, hence the overall bias for brokers to remain positive. That said, it’s my opinion that quality / independent advice will always win out in the long run.
Orica (ORI) Ltd Chart
Question 10
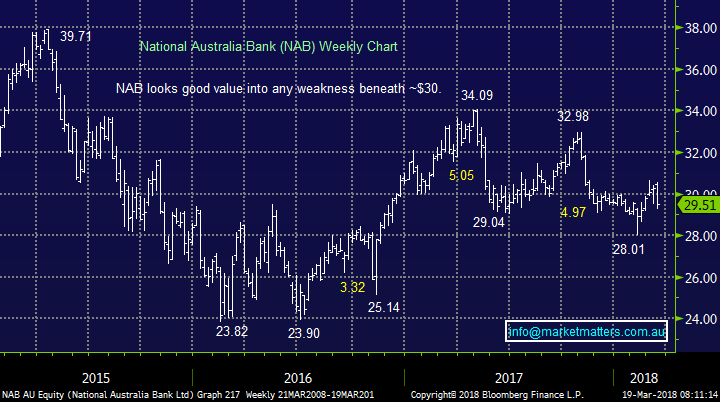
“Hi guys, NAB only just held on to the $29.50 level on Friday, what is your view going forward on its potential low where it could be a good buying opportunity (like CBA at $73)? The $29.50 level also looks to be a good area of support for WBC.” – Regards Sean C.
Morning Sean, If CBA is going to hit ~$73 then NAB / WBC are likely to break well under $29, I would stick with our general thoughts of buy weakness created by the Banking Royal Commission. At this stage it’s hard to imagine any positive news flow short-term and we will be looking for a day when the banks can shrug off bad news, often a sign of a short-term low.
National Australia Bank (NAB) Chart
Question 11
“ Good Morning James, Firstly thank you for an extremely informative and well-rounded offering given to subscribers. I appreciate the depth and breadth of information given about the market, as well as your current thoughts as in combination it provides a great framework.
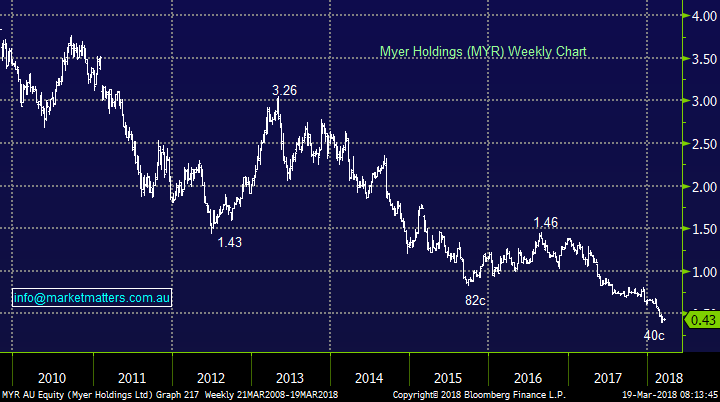
My question concerns short selling. I understand the basic premise around short selling i.e. sell stocks now in the hope of buying them back at a lower price later. But when you say "Myer is 10.2% shorted". Does this mean a straight stock sale (which I believe can only be done by the institutions), or by the buying of put options or some other instrument which can also be done by the retail market. Some clarity around this would be much appreciated.
Kind Regards Jonathan H.
Hi Johnathan, Thanks for the thumbs up. Myer has currently a 10.05% short position which simply means about 10% of all Myer shares on issue have been short-sold, a huge amount but below the ~16% numbers of 2017. This does not include options or any other derivative however, a derivative is usually hedged with underlying stock, so for example a put option would most likely be hedged through shorting stock and therefore the numbers are mostly shown through the short percentage number.
NB These numbers always have a lag of 4 trading days.
Myer (MYR) Chart
Overnight Market Matters Wrap
· The broader US equity markets closed marginally higher, with the energy sector leading the strength, whilst IT was the laggard.
· Economic data will remain to be the focus, with investor’s anticipation on the US Federal Reserve’s predicted rate move on Thursday Australian time. For the first time in nearly a decade we are likely to see Australia’s Cash rate lower than its American Counterpart.
· BHP is expected to again outperform the broader market, after ending its US session up an equivalent of 0.94% to $29.43 from Australia’s previous close.
· The June SPI Futures is indicating the ASX 200 to open 36 points higher towards the 5990 level this morning.
Disclosure
Market Matters may hold stocks mentioned in this report. Subscribers can view a full list of holdings on the website by clicking here. Positions are updated each Friday, or after the session when positions are traded.
Disclaimer
All figures contained from sources believed to be accurate. Market Matters does not make any representation of warranty as to the accuracy of the figures and disclaims any liability resulting from any inaccuracy. Prices as at 19/03/2018. 8.13AM
Reports and other documents published on this website and email (‘Reports’) are authored by Market Matters and the reports represent the views of Market Matters. The MarketMatters Report is based on technical analysis of companies, commodities and the market in general. Technical analysis focuses on interpreting charts and other data to determine what the market sentiment about a particular financial product is, or will be. Unlike fundamental analysis, it does not involve a detailed review of the company’s financial position.
The Reports contain general, as opposed to personal, advice. That means they are prepared for multiple distributions without consideration of your investment objectives, financial situation and needs (‘Personal Circumstances’). Accordingly, any advice given is not a recommendation that a particular course of action is suitable for you and the advice is therefore not to be acted on as investment advice. You must assess whether or not any advice is appropriate for your Personal Circumstances before making any investment decisions. You can either make this assessment yourself, or if you require a personal recommendation, you can seek the assistance of a financial advisor. Market Matters or its author(s) accepts no responsibility for any losses or damages resulting from decisions made from or because of information within this publication. Investing and trading in financial products are always risky, so you should do your own research before buying or selling a financial product.
The Reports are published by Market Matters in good faith based on the facts known to it at the time of their preparation and do not purport to contain all relevant information with respect to the financial products to which they relate. Although the Reports are based on information obtained from sources believed to be reliable, Market Matters does not make any representation or warranty that they are accurate, complete or up to date and Market Matters accepts no obligation to correct or update the information or opinions in the Reports.
If you rely on a Report, you do so at your own risk. Any projections are estimates only and may not be realised in the future. Except to the extent that liability under any law cannot be excluded, Market Matters disclaims liability for all loss or damage arising as a result of any opinion, advice, recommendation, representation or information expressly or impliedly published in or in relation to this report notwithstanding any error or omission including negligence.
To unsubscribe. Click Here