Subscribers questions (CYB, MIN, NHC, VOC)
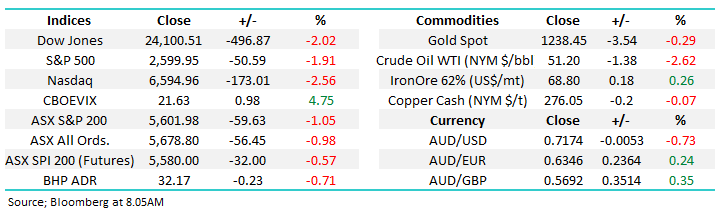
For the second Monday running the ASX200 is likely to receive a real test this morning with the Dow tumbling almost 500-points on Friday night while no domestic news over the weekend looks likely to lend support to equities on the open today.
With US stocks closing at their lowest level since April if we are going to get any sort of Christmas rally this year it’s going to require an impressive turnaround in sentiment, we remain bullish into January but with reduced conviction than in previous weeks – you only have to read todays questions to comprehend that many investors are losing patience with the market – potentially a good sign. Remember one of our favourite Warren Buffet quotes - "We simply attempt to be fearful when others are greedy and to be greedy when others are fearful."
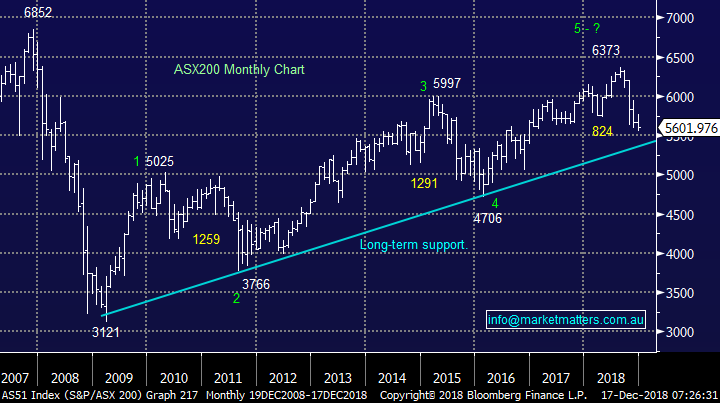
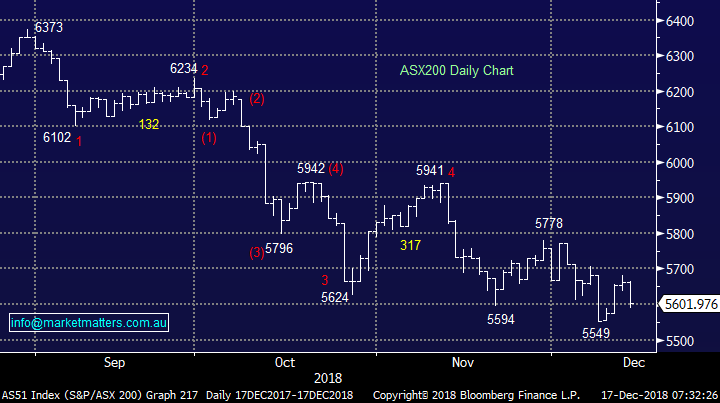
We remain mildly bullish the ASX200 short-term targeting the 5900 area.
Thanks again for some great questions, especially as Christmas is almost upon us.
ASX200 Chart
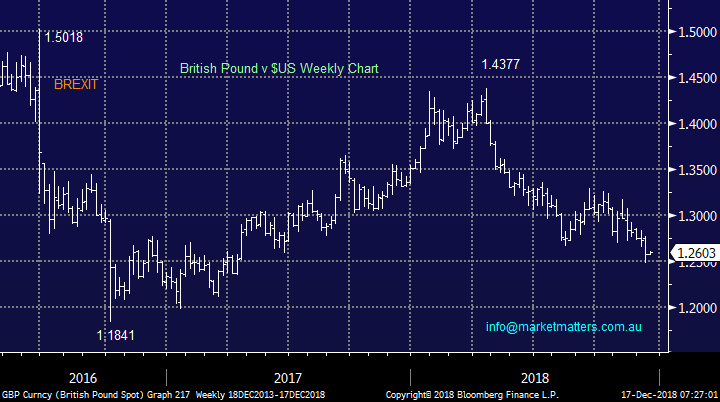
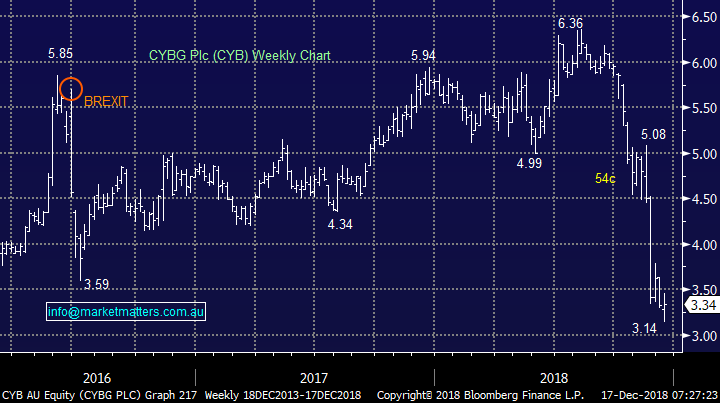
One market worth watching very closely today is the British Pound and UK related stocks i.e. CYBG Plc (ASX: CYB) and Janus Henderson (ASX: JHG). Both of these stocks plunged around 40% when the BREXIT vote shocked the world but now the possibility of a new referendum is gaining momentum with strong rumours that the dominant powers in UK politics the Conservatives and Labour had talks this weekend to consider a second vote.
Personally I can’t imagine this mess being resolved in any other way.
British Pound v $US Chart
CYBG Plc (ASX: CYB) Chart
Question 1
“Hi James & Team, I read the following somewhere, "Dow Theory Confirmed: SELL Christian DeHaemer This is an ominous chart. This is the Dow Jones Transportation Average. And it looks dangerous. You see, when the transports and the Dow Jones Industrial Average agree, it gives us a clear sign of where the stock market is heading. Both charts have broken their respective support lines. Both are in downtrends, with lower highs and lower lows. I’ve been using the Dow theory for years. Back in 2013, I used it to confirm one of the biggest bull markets of all time, writing:
Back in May, I wrote in this space that the Dow Theory signalled a screaming buy on the Dow Industrials. Since then, the Dow Industrial Average has added more than 1,000 points — and is now trading at 15,610, You can't argue with those returns. What is your opinion on this?” – Sidney.
Hi Sidney,
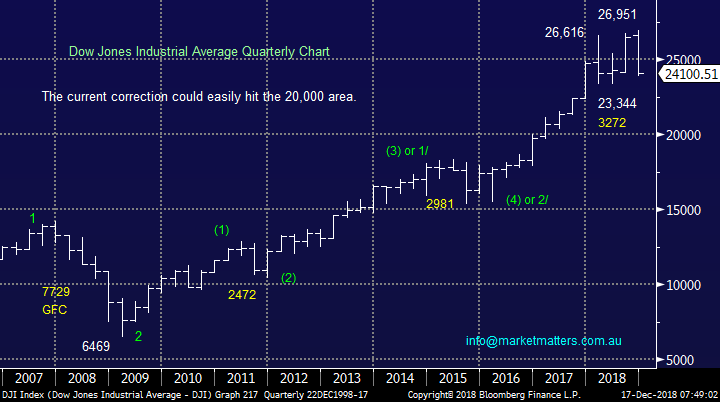
I think we basically answered this one in the Weekend Report on Sunday, we believe stocks will trend lower in 2019 / 2020 as they correct the largest bull market in history. Even after a tough quarter the Dow is still sitting over 250% above its post GFC low. Market don’t go up or down in straight lines and corrections are healthy although they obviously don’t feel like it at the time – like now!
However we must all remain open-minded as we are very confident that recent volatility will almost become the new norm. The short-term concern for the Bears is that US stocks are building in a recession to prices but the economy is still solid today, surprises can easily be to the upside if only short & sharp over a few weeks.
MM is likely to hold a conservative portfolio and large cash positions / negative ETFs at times in 2019 / 2020.
Dow Jones Chart
Question 2
“A very interesting read after last week's volatility. I wonder if you can give an opinion on MIN after Friday's after market news on the $1.15B investment by Albemarle for 50% of MIN's lithium operation. I’m assuming there will be a reasonable jump in the stock price once the trading halt ends.
I own MIN and have topped up recently. What should be the upside for the current and medium-term share price? Is it a case of sell on the news or wait for analyst upgrades and short covering to push the price potentially higher?” – Regards David H.
Hi David,
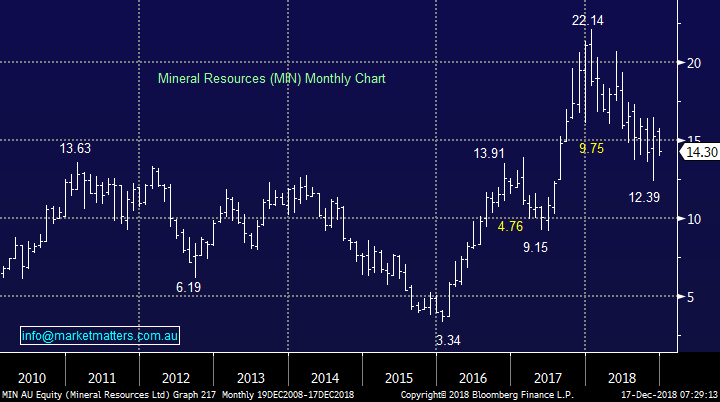
As you say Mineral Resources (ASX: MIN) went into a trading halt on Friday to allow management to announce a binding sales agreement / share subscription with Albemarle Corporation in relation to the sale and joint venture of a 50% interest in the Wodgina Lithium Project. We would expect the stock to reopen higher today given the market had some prior concerns that the MD Chris Ellison was simply talking his book – a signed deal will give the market some comfort. However, its worth pointing out a number of 2018 tops for the lithium stocks have been created by similar announcements i.e. the market appears to be a seller of strength within the sector.
While we can only provide general comments as apposed to advice specific to you, the technical picture is fairly clear:
1 – Any very strong opening looks likely to hit initial resistance ~$19.
2 – If the stock rallies above $16.50 we would run stops at $15.50.
3 – We would be very concerned if the stock fails to hold $14.
Interestingly Morgan Stanley who have recently upgraded their resources targets have a valuation on MIN above $22, perhaps we will see a test of initial $19 resistance.
Mineral Resources (ASX: MIN) Chart
Question 3
“James, isn’t it about time we gave up all this talk of Santa rallies or whatever? The fact that the market may or may not have bounced last year or 7 times in the last 10 years or whatever statistic you care to show has little bearing on what the market is likely to do in today’s climate. There are many different and competing factors in play which were not there last year or whenever. Most of them we cannot control viz the mutterings of Trump etc but we can take them into account to try to form a macro picture of where we are or are likely to go in the short to medium term and then add to that the strength or otherwise of different sectors/ companies to get a much better forecast than the magic pudding of a “Santa Rally” “– Regards Peter.
Hi Peter,
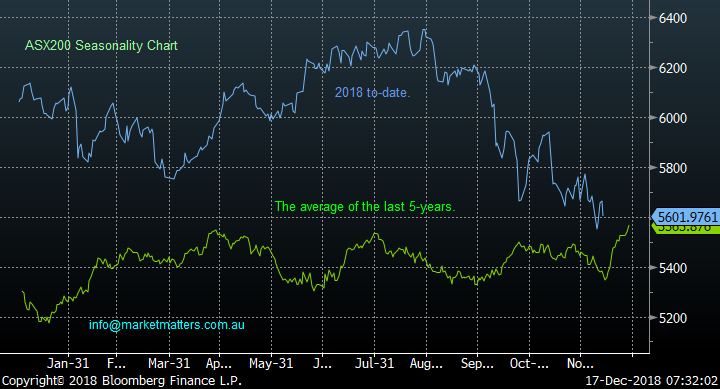
While I can’t totally disagree with you, investing is all about probabilities rather than certainties. Simple statistics tell us that in the last 30 December’s, 25 of those have been positive while if we have a negative November, 27 out of 30 Decembers have been positive, implying a very good chance December should be positive. The factors you’ve outlined could certainly de-rail a Christmas rally, this year might be in the minority, however experience tells me not to trade against such a strong seasonal trend, similar to our general caution towards the back end of May / April each year. Don’t forget there is always something on the news / fundamental front saying this time is different e.g. why stocks / housing would keep rallying in 2018 or as you allude to why stocks will not be able to enjoy a meaningful Christmas bounce from todays 5600 area, almost 13% below the years low.
MM writes / trades an active approach and to do that we need to have a view that should add some value / alpha around the edges. If you recall in October we were underweight equities and have only gone fully long fairly recently looking for a pop towards 5900. As we said in Question 1 MM does intend to: – “MM is likely to hold a conservative portfolio and large cash / negative ETF positions at times in 2019 / 2020.”
ASX200 Seasonality Chart
Question 4
“A terrible day for all of us but I think MM are too highly invested in this current market. 100% invested is for me very uncomfortable as there is no firepower left when days like this happen. . . . food for thought. I think we are in for some tough years ahead.” -Anthony B.
Hi Anthony, Obviously a question in a similar vein to a few of the above. We feel the markets is ultimately going lower but as we often say “Bear Markets often resemble a ping pong ball going down a staircase, its going to reach the bottom but there will be some large bounces back up along the way”.
We currently only have 4% of the MM Growth Portfolio in cash and we do expect this to be higher in the weeks ahead.
ASX200 Chart
Question 5
“Hi, even though MM are fully invested due to an expectation in a bounce to 5900, I think it is important to still provide ideal buying points for those sitting on cash. Will this be something you can still recommend even though you are sitting on 0% cash?” - Regards, Scott D.
Hi Scott,
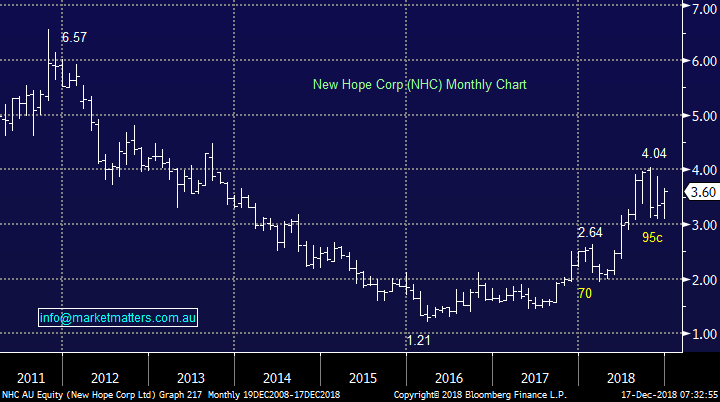
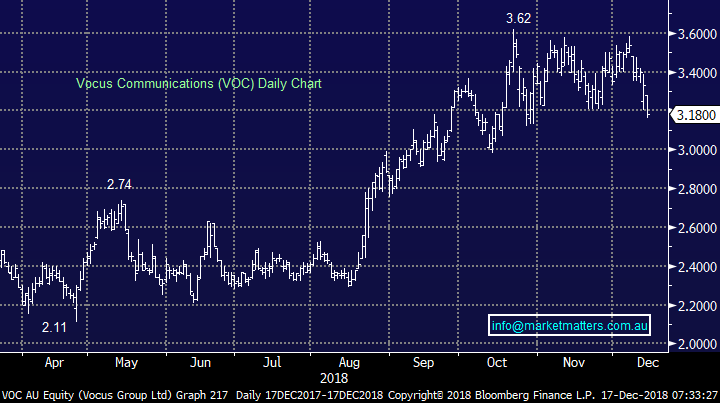
Absolutely, we continue to talk about opportunities, there were some in the weekend report. Shorter term plays in Australia we like New Hope (ASX: NHC) at today’s levels and Vocus (ASX: VOC) around $3.10.
Obviously we may fund any purchases in a few different ways as MM only has 4% in our Growth Portfolio e.g. By selling one of QBE 7/or Suncorp, our IEM ETF, Janus Henderson on any BREXIT optimism and / or part of our TLS position.
In the US market we like Apple, JP Morgan and Wells Fargo into current weakness
New Hope Corp (ASX: NHC) Chart
Vocus (ASX: VOC) Chart
Overnight Market Matters Wrap
· The Christmas rally is yet to be seen across the globe as US equity markets resumed its downward trend last Friday, as global economic concerns of a slowdown is widely anticipated following the weak data from China and Europe.
· The US Fed is expected to raise rates this week, however economic data and sentiment are affecting the number of future rate rises. The Fed dot plot suggests three hikes in 2019, versus the market expectations for just the one raise.
· We expect weakness to continue from last Friday, with BHP expected to lose a further 0.71% this morning after its performance in the US.
· The December SPI Futures is indicating the ASX 200 to open 24 points lower, towards the 5575 level this morning.
Have a great day!
James & the Market Matters Team
Disclosure
Market Matters may hold stocks mentioned in this report. Subscribers can view a full list of holdings on the website by clicking here. Positions are updated each Friday, or after the session when positions are traded.
Disclaimer
All figures contained from sources believed to be accurate. Market Matters does not make any representation of warranty as to the accuracy of the figures and disclaims any liability resulting from any inaccuracy. Prices as at 17/12/2018
Reports and other documents published on this website and email (‘Reports’) are authored by Market Matters and the reports represent the views of Market Matters. The MarketMatters Report is based on technical analysis of companies, commodities and the market in general. Technical analysis focuses on interpreting charts and other data to determine what the market sentiment about a particular financial product is, or will be. Unlike fundamental analysis, it does not involve a detailed review of the company’s financial position.
The Reports contain general, as opposed to personal, advice. That means they are prepared for multiple distributions without consideration of your investment objectives, financial situation and needs (‘Personal Circumstances’). Accordingly, any advice given is not a recommendation that a particular course of action is suitable for you and the advice is therefore not to be acted on as investment advice. You must assess whether or not any advice is appropriate for your Personal Circumstances before making any investment decisions. You can either make this assessment yourself, or if you require a personal recommendation, you can seek the assistance of a financial advisor. Market Matters or its author(s) accepts no responsibility for any losses or damages resulting from decisions made from or because of information within this publication. Investing and trading in financial products are always risky, so you should do your own research before buying or selling a financial product.
The Reports are published by Market Matters in good faith based on the facts known to it at the time of their preparation and do not purport to contain all relevant information with respect to the financial products to which they relate. Although the Reports are based on information obtained from sources believed to be reliable, Market Matters does not make any representation or warranty that they are accurate, complete or up to date and Market Matters accepts no obligation to correct or update the information or opinions in the Reports. Market Matters may publish content sourced from external content providers.
If you rely on a Report, you do so at your own risk. Past performance is not an indication of future performance. Any projections are estimates only and may not be realised in the future. Except to the extent that liability under any law cannot be excluded, Market Matters disclaims liability for all loss or damage arising as a result of any opinion, advice, recommendation, representation or information expressly or impliedly published in or in relation to this report notwithstanding any error or omission including negligence.


