How we will “play” these choppy markets
A fascinating chart passed across my desk yesterday from Tom McClellan, a US analyst who was made famous by the McClellan Oscillator – a well-known technical indicator that I think was actually created by his parents. Anyway, I regularly read his insight simply because he has knack of creating “light bulb” moments while I’m looking at the ASX200 / local stocks.
The below chart shows the S&P500 under both US Presidents Clinton & Trump, while they are clearly very different leaders / people they both won without the majority of the popular vote and subsequently set about reorganizing a government to suit themselves. Similarly they both suffered scandals in their first 2-years in the White House and a share market which corrected aggressively before recovering solidly, plus just for good measure the Fed was raising interest rates. Uncanny?
He produced the below chart in late August this year and its following accuracy so far has been simply amazing, as you can see if the pattern continues stocks are about to rally / recover strongly.
The S&P500 1994 v 2018 Chart
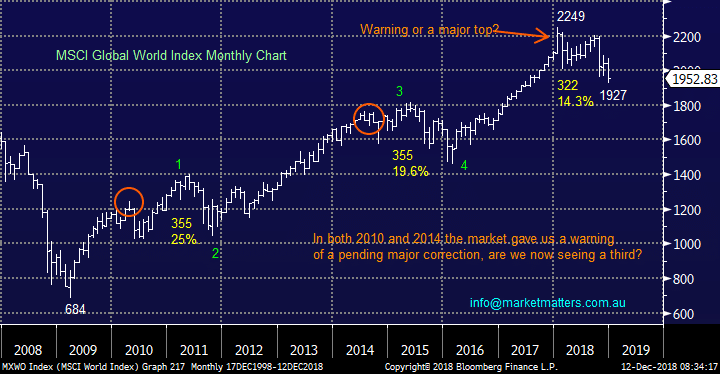
 As subscribers know we can see the current post GFC bull market remaining “choppy” but following an appreciation of over 200% investors would be almost greedy not to expect some 10-20% corrections – its common market patterns.
MM is currently a touch 50-50 whether the latest correction is complete, or close, and hence whether we can see a strong rally from current levels as the 1994 overlay suggests. The average correction of the ASX200 over the last decade since the GFC is less than 14% and we have already fallen over 13% since August so statistically this is an ideal time to be buying – certainly has felt the hard option over recent weeks but it usually does when its correct!
However there are some standout views we have for the coming years:
1 – Market volatility will remain elevated hence investors should be prepared to sell strength and buy weakness – this would have certainly worked well in last few weeks.
2 – Boring more traditional “Blue Chip” stocks will outperform the high valuation / growth stocks over many quarters, unlike the last few years.
3 – A conservative style portfolio with sustainable solid yield should perform well and help investors sleep, especially when hedged at times.
As subscribers know we can see the current post GFC bull market remaining “choppy” but following an appreciation of over 200% investors would be almost greedy not to expect some 10-20% corrections – its common market patterns.
MM is currently a touch 50-50 whether the latest correction is complete, or close, and hence whether we can see a strong rally from current levels as the 1994 overlay suggests. The average correction of the ASX200 over the last decade since the GFC is less than 14% and we have already fallen over 13% since August so statistically this is an ideal time to be buying – certainly has felt the hard option over recent weeks but it usually does when its correct!
However there are some standout views we have for the coming years:
1 – Market volatility will remain elevated hence investors should be prepared to sell strength and buy weakness – this would have certainly worked well in last few weeks.
2 – Boring more traditional “Blue Chip” stocks will outperform the high valuation / growth stocks over many quarters, unlike the last few years.
3 – A conservative style portfolio with sustainable solid yield should perform well and help investors sleep, especially when hedged at times.
The MSCI World Index Chart
 Lets consider a basket of stocks like CBA, Telstra and even BHP, they will generate a yield of around 6% fully franked for an investor compared to say a term deposit paying 3% unfranked. However the clear risk is preservation of capital.


