Why are Energy stocks struggling while crude oil continues to rally? (ORG, WPL, BPT, STO)
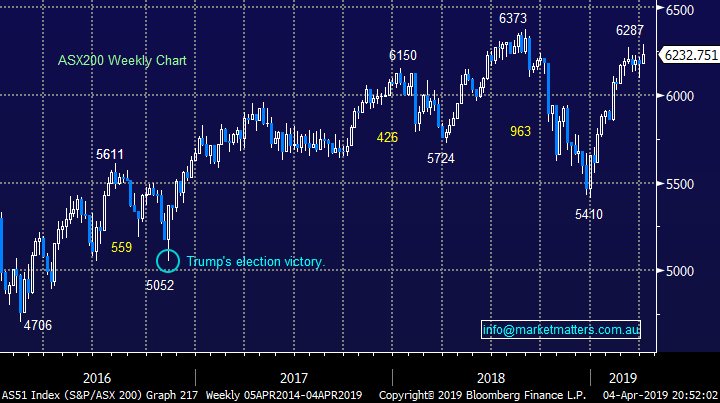
The ASX200 came down to earth with a thud yesterday and any further weakness today will have the 877-point / 16.2% rally from Decembers low looking & feeling complete with clear negative ramifications for Q2 of 2019. We have been targeting a range for Q2 2019 of 6000 to 6300 and if Wednesdays 6287 is the end of the current rally the initial likely pullback area is potentially below 6000. A break of the April low at 6180 will statistically target 6100 in the next few weeks, we believe it’s a time to be cautious for the bulls.
On the sector level the standout weakness not surprisingly was from 4 of the high fliers of 2019 as investors appeared to take some $$ from the table – the Energy, large cap Resources, Transport and Utilities sectors - perhaps the market read our morning report yesterday with regard to last 2. There was little to get excited about on the positive side of the ledger although we did enjoy seeing Healius (HLS) rally almost 5% to make fresh 4-week highs, perhaps new takeover news is around the corner.
On the US-China front we saw President Donald Trump say that talks with Chinese officials are “moving along very nicely” and he’ll meet with Vice Premier Liu imminently but we are concerned this could be a classic case of “buy on rumour, sell on fact“. Markets have rallied strongly in anticipation of a deal taking the hugely influential Semiconductor Index to a fresh all-time high illustrating the markets optimism around the outcome.
The ASX200 has now achieved our upside target area switching us back to a neutral / bearish stance short-term.
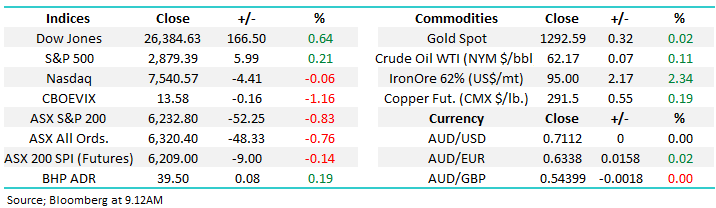
Overnight, The Dow Jones Industrial Average touched a six-month high, led by gains in Boeing, Dow and Disney but the broader based S&P500 close basically unchanged, the SPI futures are calling the ASX200 to open down around 10-points.
Today we are going to look at the Australian Oil sector and the underlying crude oil price as it appears that it might be calling a downturn at least short-term.
ASX200 Chart
Bitcoin $US
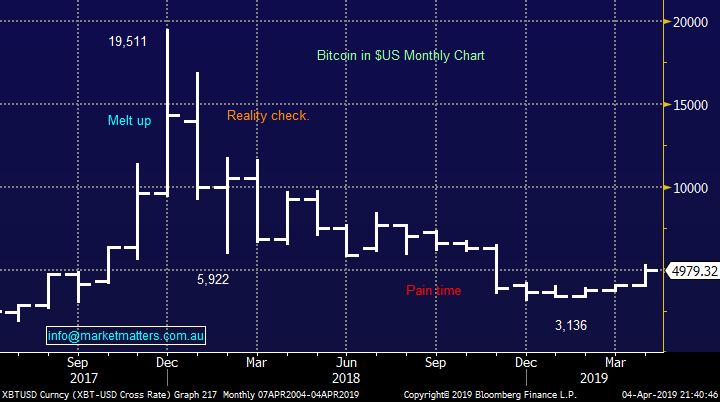
The crypto currency Bitcoin has jumped back into the limelight this week going “crazy” rallying over 30% before falling ~10% last night. Technically an eventual bounce back towards 6000 would not surprise which is exciting if you bought last week but not if your long from late 2017.
MM will not be buying Bitcoin but we can see reasons for traders to be buying pullbacks over the coming weeks / months.
Bitcoin ($US) Chart
Watching / cutting your losers is arguably more important than picking winners when it comes to the underlying performance of an equity portfolio.
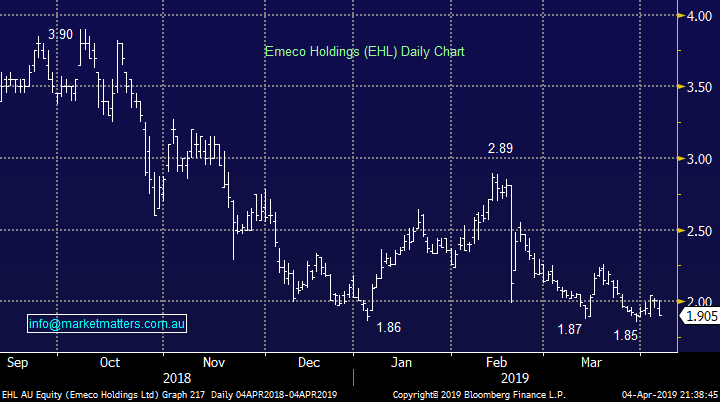
One of our “dogs” of recent times has continued to drift lower since we went long leading us to ponder should we “cut, average or hold?” The leaser of earthmoving moving equipment Emeco Holdings (EHL) is now trading on a relatively pessimistic P/E for 2019 of 8.9x, after being sold down yesterday. Worth noting that they 25% of yesterday selling was one older from what I could see which is unlikely to be their entire line of stock.
For that reason, we’ll stay patient on EHL for now, with our ideal buy level closer to $1.80, or another 5% lower.
At this stage MM is looking to average our EHL holding into fresh 2019 lows.
Emeco holdings (EHL) Chart
Is the Oil sector “calling” a downturn in the commodity?
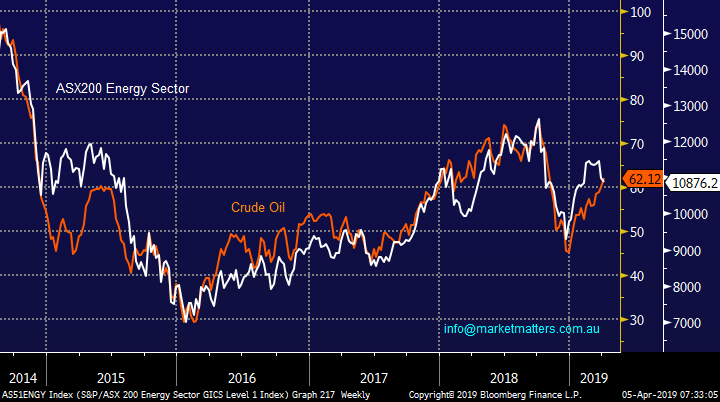
The chart below illustrates perfectly the large degree of correlation between the crude oil price and the Australian Energy sector – no great surprise there.
However over the last few weeks while we’ve seen the crude oil price make fresh 2019 highs the local Energy sector has fallen over 6% - remember stocks usually lead and the reasons follow. The wild card with todays delve into market / sector correlation is the selling by Norwegian sovereign wealth fund (Norges Bank) i.e. a $8bn seller has been let loose.
In March we heard the Norges Bank will divest $8 billion worth of oil and gas holdings, which potentially include stakes in Woodside (WPL), Santos (STO), Oil Search (OSH) and Beach Energy (BPT). The selling is because Norway wants to understandably phase out holdings classified as exploration and production companies from the portfolio in order to "reduce the aggregate oil price risk in the Norwegian economy". In short, Norway relies heavily on oil and gas and to then expose the sovereign wealth fund to more oil and gas via investments in stocks doesn’t make sense. That said, it’s not completely new news, Norway's pension fund embarked on its fossil fuel divestment campaign five years ago.
At the end of 2018, they owned shares in around 300 oil producers and service companies including ~1% of WPL which puts their stake around only ~1-weeks turnover, nothing too scary.
We believe there’s a reasonable probability that the Australian Energy sector is calling a meaningful top in crude oil , although our local names would likely be higher without the potential influence from Norges Bank
NB The US and global energy sectors have not struggled like our own, this can be taken both ways.
ASX200 Energy Sector v Crude Oil Chart
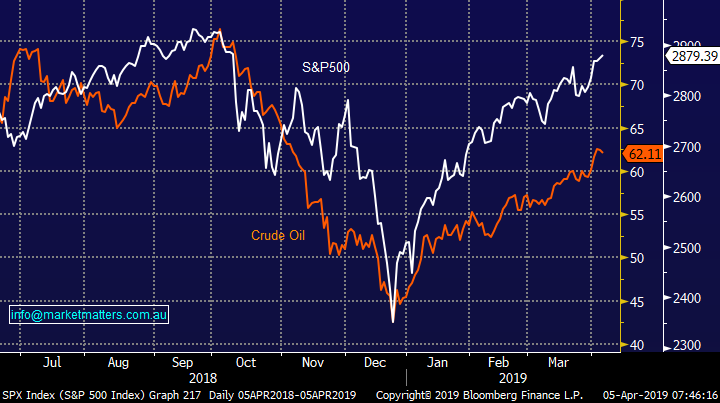
The ramifications from the previous reasoning is potentially large due to the strong correlation between crude oil and US stocks i.e. a correction in the crude oil price implies strongly that US stocks will follow suit. Obviously it’s a couple of big steps to use the Australian Energy sector to forecast the US share market but it all comes down to boring old risk / reward.
MM believes the risk / reward is now on the sell side for US stocks.
US S&P500 v Crude Oil Chart
Now quickly moving onto 4 energy stocks from the ASX200.
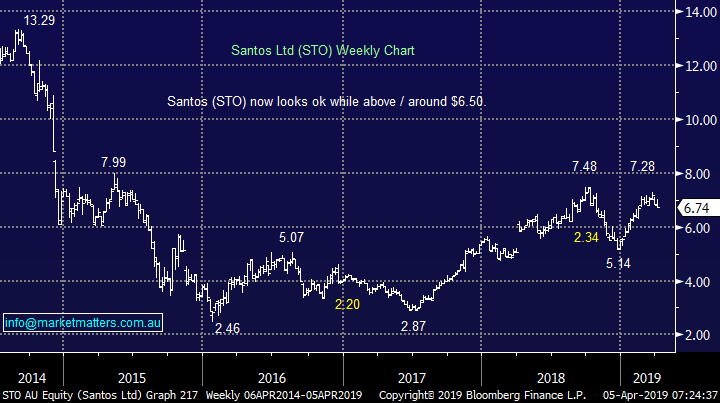
1 Santos (STO) $6.74
Santos (STO) recorded a solid report in February, they delivered a full year underlying profit of $US727m with free cash flow above $US1bn. STO has now turned from survival mode into growth mode - perhaps we will see another takeover offer as suitors run out of time with the share price appreciation.
This is a stock we are happy to accumulate into weakness but not chase into strength, our initial buy zones are $6.50 and $6.30.
MM continues to like STO close to $6.50, around 4% lower.
Santos (STO) Chart
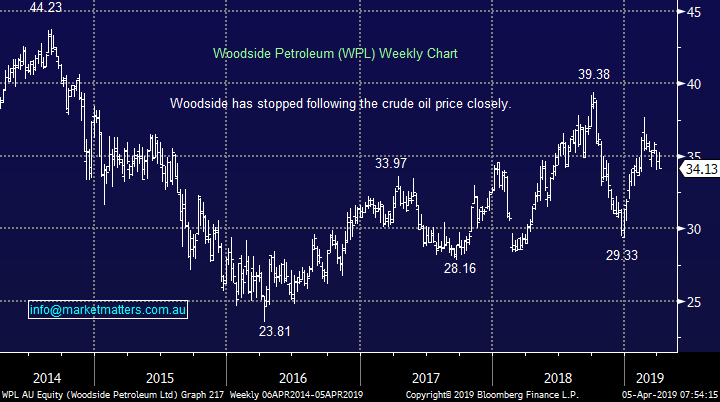
2 Woodside Petroleum (WPL) $34.13.
MM bought WPL into weakness in March for our Income Portfolio taking advantage of its decent pullback – the stocks currently expected to yield 5.87% fully franked in the next 12-months which we find very attractive in today’s low interest rate environment.
The company’s most recent production update in January was solid showing revenue up to US1.4bn helped by higher prices and increased production. This is a solid Australian business whose current Est. P/E for 2019 of 14.5x is not scary however this is undoubtedly a play around energy prices, if they fall WPL is going to struggle hence we only allocated 4% into the Income Portfolio.
We will be watching any weakness that may be caused by a potential decline in crude oil for an allocation into the MM Growth Portfolio.
MM likes WPL from a business and yield perspective.
Woodside Petroleum (WPL) Chart
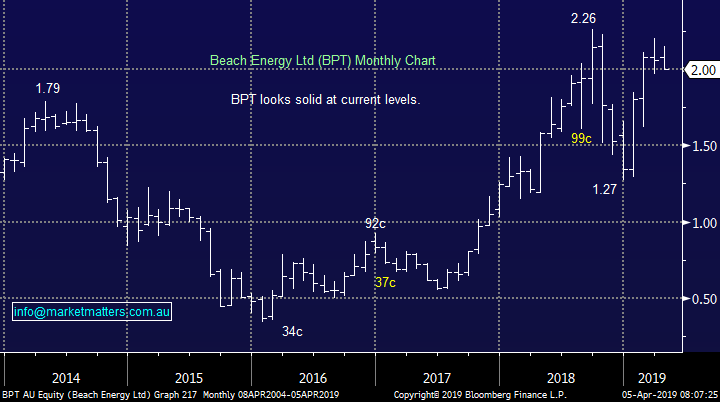
3 Beach Petroleum (BPT) $2
BPT has enjoyed an excellent start to the year helped by a doubling of its profit in the first half of 2019 to an underlying net profit of almost $280m. Technically and fundamentally we are bullish BPT medium-term targeting 15% upside.
Technically BPT will look interesting ~$1.90, or 5% lower.
Beach Petroleum (BPT) Chart
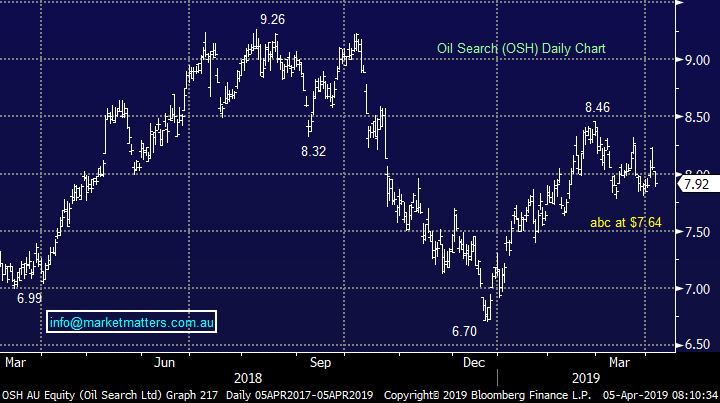
4 Oil Search (OSH) $7.92
OSH has been the “boring” member of the sector during both falls and rises, not a bad thing but with a low yield capital appreciation is required to make the stock attractive.
This is one member of the sector which struggled this year after releasing their latest report which showed a 6% increase in 4th quarter revenue to over $US500m but the 1% fall in production left investors unimpressed.
MM likes OSH around $7.64, or over 3% lower.
Oil Search Ltd (OSH) Chart
Conclusion
MM believes there’s a reasonable possibility the Australian Energy sector is calling a pullback in the underlying crude oil price, however the Norges Bank selling has mudded the water short-term.
We will consider a few members of the sector 4-5% lower with an ideal catalyst some resilience evident even if crude does trade lower.
Global Indices
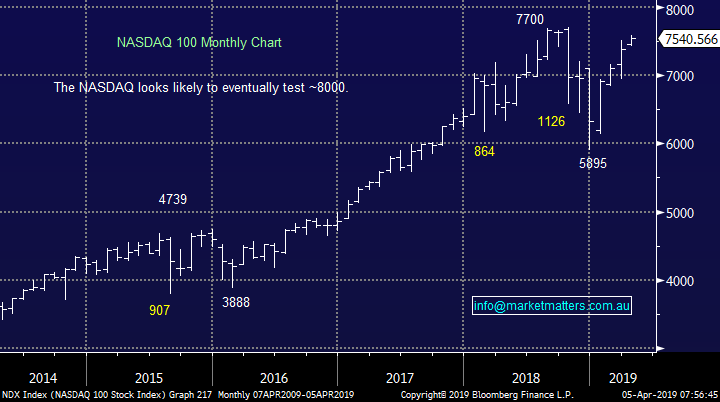
US stocks closed mixed last night with the tech based NASDAQ drifting slightly lower while the Dow punched up +0.6%. We still think the NASDAQ has another ~6% upside medium-term but the next few weeks look more questionable.
With both the S&P500 and tech based NASDAQ reaching fresh 2019 highs we have turned mildly neutral / negative US stocks.
US NASDAQ Chart
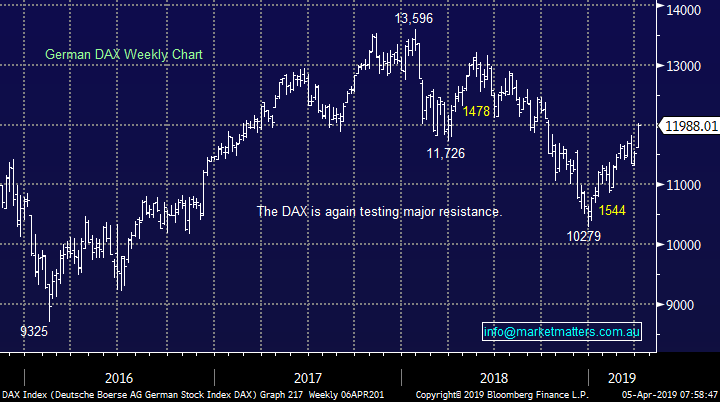
No change with European indices even as the BREXIT fiasco rolls on, markets are encountering some selling from our targeted “sell zones”, we remain cautious or even bearish the region at this stage, especially into fresh 2019 highs.
German DAX Chart
Overnight Market Matters Wrap
- The Australian market is expected to open a little weaker again this morning on mixed signals overnight with the 30 stock Dow over 150pts firmer, led by Boeing, Dow and Walt Disney, but the Nasdaq and S&P little changed with tech stocks mixed.
- President Trump is due to meet with China’s top trade negotiator Vice President Liu He in the White House today and it was also reported that he is planning to announce a date for a trade summit with president Xi Jinping as the talks drag on. Wall St has witnessed a strong rally into 2019 with the NASDAQ in particular leading the way, up close to 20% ytd on expectations of a resolution of the trade dispute.
- On the commodity front, Brent oil prices briefly touched US$70/bbl before easing back towards US$69.20/bbl, base metals and iron ore are slightly lower while the gold price is just under US$1300/oz. The A$ remains above US71c.
- The June SPI Futures is indicating the ASX 200 to open marginally lower, testing the 6225 level this morning.
Have a great day!
James & the Market Matters Team
Disclosure
Market Matters may hold stocks mentioned in this report. Subscribers can view a full list of holdings on the website by clicking here. Positions are updated each Friday, or after the session when positions are traded.
Disclaimer
All figures contained from sources believed to be accurate. Market Matters does not make any representation of warranty as to the accuracy of the figures and disclaims any liability resulting from any inaccuracy. Prices as at 05/04/2019
Reports and other documents published on this website and email (‘Reports’) are authored by Market Matters and the reports represent the views of Market Matters. The MarketMatters Report is based on technical analysis of companies, commodities and the market in general. Technical analysis focuses on interpreting charts and other data to determine what the market sentiment about a particular financial product is, or will be. Unlike fundamental analysis, it does not involve a detailed review of the company’s financial position.
The Reports contain general, as opposed to personal, advice. That means they are prepared for multiple distributions without consideration of your investment objectives, financial situation and needs (‘Personal Circumstances’). Accordingly, any advice given is not a recommendation that a particular course of action is suitable for you and the advice is therefore not to be acted on as investment advice. You must assess whether or not any advice is appropriate for your Personal Circumstances before making any investment decisions. You can either make this assessment yourself, or if you require a personal recommendation, you can seek the assistance of a financial advisor. Market Matters or its author(s) accepts no responsibility for any losses or damages resulting from decisions made from or because of information within this publication. Investing and trading in financial products are always risky, so you should do your own research before buying or selling a financial product.
The Reports are published by Market Matters in good faith based on the facts known to it at the time of their preparation and do not purport to contain all relevant information with respect to the financial products to which they relate. Although the Reports are based on information obtained from sources believed to be reliable, Market Matters does not make any representation or warranty that they are accurate, complete or up to date and Market Matters accepts no obligation to correct or update the information or opinions in the Reports. Market Matters may publish content sourced from external content providers.
If you rely on a Report, you do so at your own risk. Past performance is not an indication of future performance. Any projections are estimates only and may not be realised in the future. Except to the extent that liability under any law cannot be excluded, Market Matters disclaims liability for all loss or damage arising as a result of any opinion, advice, recommendation, representation or information expressly or impliedly published in or in relation to this report notwithstanding any error or omission including negligence.


