Subscribers questions (ECX, MXT, EHL, TLS, SGM, CHC, CAT, BAP)
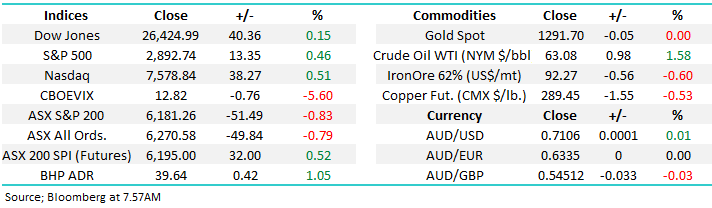
The SPI futures are implying the ASX200 will start the week off on a positive footing following strong gains by Wall Street on Friday night, with BHP closing up ~1% in the US the local market looks likely to open up around 30-points, back above the 6200 level. Stocks rallied in the US following solid employment data which allayed concerns around the health of their economy although on the other side of the coin bond yields did rise marginally. However some US investment banks still expect the last quarter will be the first earnings recession in almost 4-years. – we believe stocks will need good quality fuel to push significantly higher from today’s valuation levels.
Local news over the weekend remains dour with the IMF now worried around the Australian property downturn which won’t be helped by 20% of auctions being pulled over the weekend due lack of buyers – although those properties that did go to auction, saw decent clearance rates. Also, the Liberals budget may have gone down ok but it appears their chances of being re-elected is fading rapidly i.e. Sportsbet now has Labor at 1.14x while the Coalition is at 5x, that’s the odds of a one horse race.
MM’s preferred scenario is the ASX200 will now correct its 877-point / 16.2% rally from Decembers panic low, our initial target levels are 6100 and then 6000.
MM remains in “ buy mode” looking for the abovementioned pullback to increase our market exposure.
Thanks for an almost record number of questions this week, its always very satisfying for us to see such an engaged subscriber base at MM – thanks!
ASX200 Index Chart
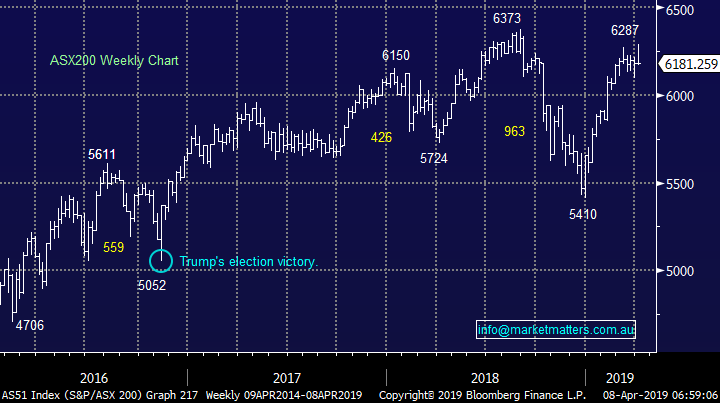
This week is a simple refresh of what we wrote on the $A v iron ore relationship – the elastic band is tightening almost weekly. MM has stuck to our bullish call for the $A into 2019 / 2020 initially targeting the 80c area – an opinion we understand not all subscribers agree with but as we often say “that’s what makes a market”.
We believe the updated chart should be a touch worrisome for the “Aussie Bears”, the likes of Fortescue (FMG) and RIO Tinto (RIO) have fully embraced the strong rally by iron ore in 2019 but the highly correlated $A has ignored the bulk commodity – so far.
Australian Dollar ($A) v Iron Ore Chart
Question 1
“Good morning gentlemen, Have you a view on ECX now that MMS / ECX have parted?” - Enjoy reading your reports Jeremy P.
Morning Jeremy,
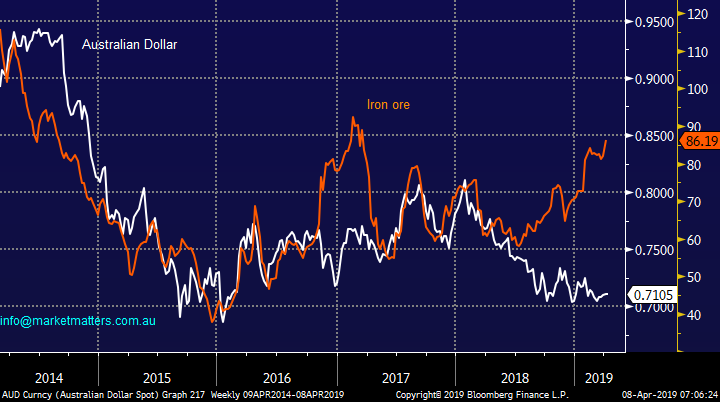
Previously we had put ECX in the “too hard basket” but perhaps it’s now time to shift gears and move it onto high risk / aggressive traders menu.
The trend is clearly down hence if we were “punting” in this scary pond it would only be to buy days of extreme weakness looking for short / sharp bounces. We want to see some solid fundamental improvement moving forward before we consider ECX as a portfolio buy. Watch for catalysts like the sale of Gray’s Online or Right2Drive at good prices as the circuit breaker for the current decline.
MM still has no interest in ECX at this point in time.
Eclipx (ECX) Chart
Question 2
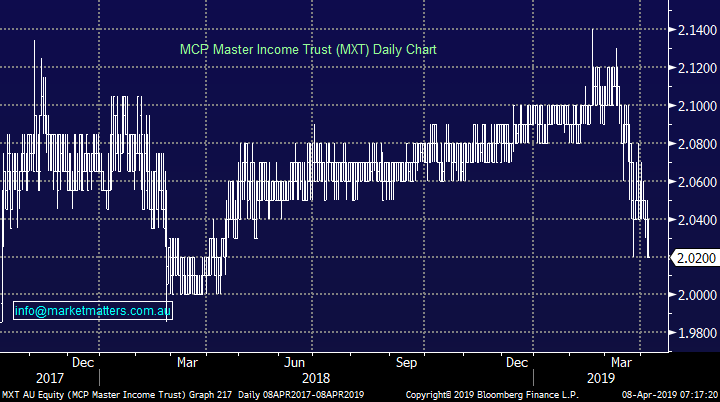
“Hi James, I note that MXT has come back quite a bit in price, is this of a concern? or could it be viewed as an opportunity to top up, given interest rates may fall further. Regards John D.
“Hi, James what is your thought about MXT in the recent couple of weeks? how come its price dropped too much from 2.12 to lowest level 2.03 ? is the new MOT influence its price performance? should I get in again if I have cleared my holding already?” – Michael.
Hi guys ,
A couple of reasons for the recent pullback. Firstly, MXT was trading at $2.12 while its NAV (the value of its assets) were just a shade over $2. Metrics (the manager of MXT) then launched a new offer, MOT which as we said at the time was the higher risk cousin of MXT, and some money has likely come out of MXT to fund MOT which on paper is offering better returns, although by taking on a lot higher risk & finally there has been a few other new offers in the space recently and it may make sense for some to sell a security trading at a 6% premium to assets and buy a new security in line with NAV.
This remains a good security and buying as close to $2 makes sense.
MM likes MXT around $2.
MCP Master Income Trust (MXT) Chart
Question 3
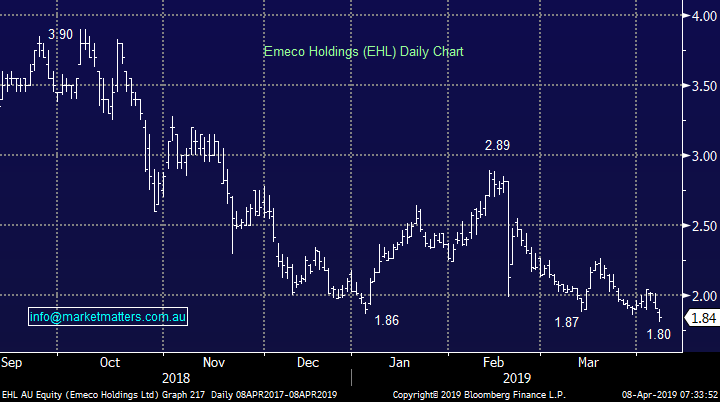
“EHL: “Worth noting that they 25% of yesterday selling was one holder from what I could see which is unlikely to be their entire line of stock” ????
“Hi James, In today's report you are suggesting that you are looking to average your ELH holding into fresh lows. My charting shows that if the price drops below $1.905 there is a big gap before it reaches the previous high of $0.40 mid 2018. This looks like a falling knife, so at what level to do proposed to "average" out and when might that be?” – Chris B.
“Hello James and MM just interested in your view of Emeco Holdings which was mentioned back on March 13 by MM. Besides the price coming off since 2018 is there a case to buy ?” - Cheers William G.
Morning!
Some clear focus on EHL with a number of questions this week. Our conclusions so far are:
1 – If we had no position we would use this selling / weakness as an opportunity to buy.
2 – Eley Griffiths was the seller of 500k shares last week, and the sale of that parcel takes them just below substantial meaning they can now fly under the radar. They still hold around 15.5m shares from what I can tell. I don’t think this necessarily is a reason to panic, if they had their finger 100% on the pulse of the business they would have sold 6-months ago.
3 – I’m sure as you say they are likely to have more selling but they may be just reducing to get under the substantial threshold - if we see another large volume day in the weeks ahead and the shares hold up we are likely to use this as a trigger to buy.
MM is likely to remain patient with adding to our EHL holding.
On the downside Chris at this stage the momentum is slowing, albeit marginally. This position is part of the group of “dogs” we purchased where one is unfortunately likely to keep barking i.e. simple statistics when buying underperforming stocks.
Hence we are not ruling out cutting this position, or any of this group in the MM Growth Portfolio for that matter – we are watching them closely.
Emeco Holdings (EHL) Chart
Question 4
“The commentary below is not helpful, contradictory and confusing! Seriously!!!” – Scott T.
Morning Scott,
I apologise this is a mixture of time frames that has not been necessarily explained clearly enough, let’s try again:
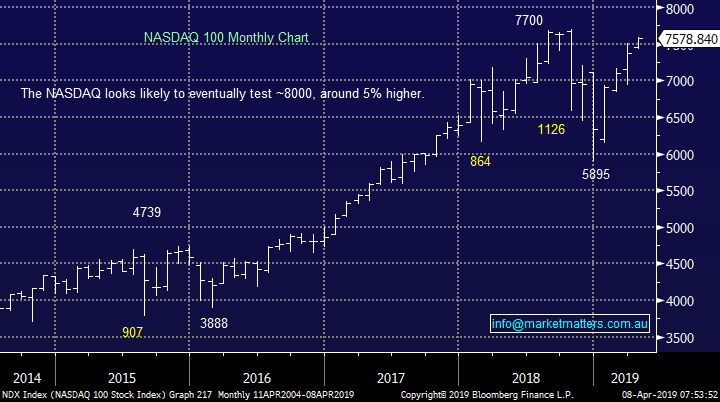
1 – We are looking for a pullback over the coming weeks from a risk / reward basis by US stocks.
2 – We remain bullish US stocks medium-term, targeting ~8000 all-time highs by the NASDAQ, or over 5% higher.
I hope this helps.
MM wrote on:
Friday
With both the S&P500 and tech based NASDAQ reaching fresh 2019 highs we have turned mildly neutral / negative US stocks.
MM believes the risk / reward is now on the sell side for US stocks.
Sunday
More specifically MM maintains its target of the 8000 area, or 5% higher.
The chart below shows US corporate bonds are making fresh 2019 highs indicating that the S&P500 should remain strong, at least short/medium-term.
The VIX’s open interest is implying the uptrend which began in late December should have a longer to run.
US NASDAQ Chart
Question 5
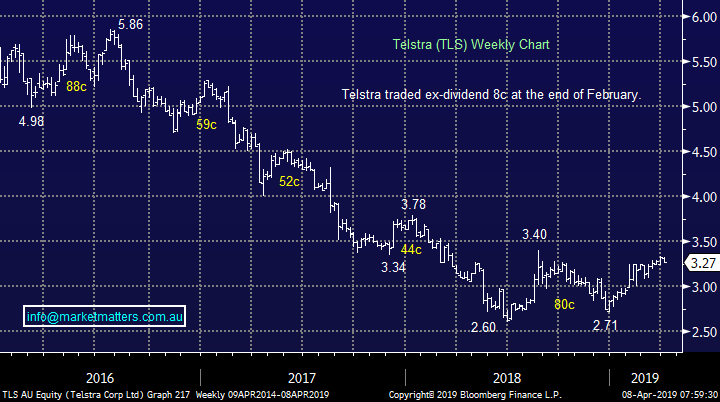
“Hi James, Just a quick bit of feedback. You’ve made the following two statements directly together. However we still intend to at least reduce our holding into anticipated strength towards $3.50. MM remains bullish TLS, at least short-term. Telstra was $3.31 at the time you wrote these statements, you state you are going to reduce your holding between there and $3.50, yet you also state you are bullish. If you are planning to sell (even part of your holding) in the next 5% price rise then it’s a bit confusing to read that you are bullish.” - Regards, Paul H.
Hi Paul,
I believe I recall TLS is one of your pet hates and a quick glance at the chart below illustrates your foundations – plus the fact no doubt they have put you on hold for a few hours, like the rest of us!
When I reread the above I agree it is a touch confusing hence I have amended the below to “mildly bullish”. We currently have a relatively large exposure to TLS and while we can see potentially higher levels than $3.50 we are simply likely to trim our risk around here.
The logic here is strongly influenced from our activity over the last year where the largest improvement in our returns would have come from “running a few positions longer” hence the intention to reduce TLS and not take all the $$ and run – we can then reassess if / when the stock has hit $3.50. I hope this helps.
MM is mildly bullish TLS, initially targeting the $3.50 area.
Telstra (TLS) Chart
Question 6
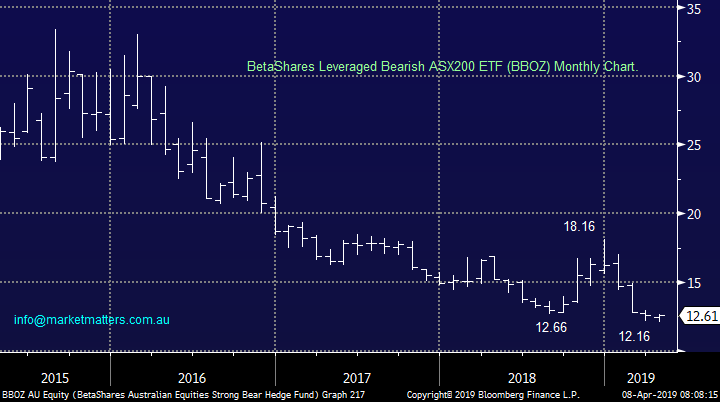
“Hi, I wish to find out more about protecting a portfolio of existing ASX shares using a hedge fund - either BetaShares BEAR or the levered BBOZ. According to the BetaShares website on the Strong Bear Hedge Fund (BBOZ) a 1% fall on the ASX can generally be expected to deliver a 2% increase in the value of the fund. I note that the management costs of BBOZ are 1.38% per annum and that there is an annual distribution. As of 03 August 2018 there were 6,850,000 outstanding units in the fund with no redemptions during the month of July 2018. Is this usual?
* If the fund is based solely on futures trading does it deal solely in short contracts only or does it use "straddles" in an obvious bull market e.g. first quarter 2019.
* Where can I obtain information on past distributions and when they are usually allocated as the Comsec website does not provide this information.
* Is there a time limit on how long an investor may hold a BBOZ ETF and the same question could apply to other bear ETFs such as BBUS.
* Are there other ETFs available which relate to various commodities traded on the futures markets such as wheat, orange juice, gold or pork bellies etc?
Keep up the good work, I have learnt a lot from reading your daily e-mails.” - Regards, John P.
Hi John,
A large question which hopefully I have covered in simple terms below:
1 – The current market cap of the BBOZ is $119m which is likely to increase significantly when markets fall. New units are issued as demand increases
2 – We look for ETF’s that are liquid, a decent open interest (market cap) and have relatively low management costs – short ETF’s usually have higher costs. Importantly, market makers participate in the ETF market so the liquidity of the underlying investments the ETF holds has the main influence on the liquidity of the ETF itself i.e. the depth of the ETF screen is not necessarily the liquidity.
3 – Investors should KISS (keep it simple stupid) with these hedge style ETF’s, you buy, hold and sell them like any other share, they have no time constraints like a futures contract.
4 – The BBOZ is not a volatility ETF hence no use for straddles, it will use futures contracts to hedge the exposure they offer in the ETF. The BBOZ will rise by a factor of 2x to 2.75x the ASX200. There is a range because the ETF provider will rebalance the underlying hedge to keep it within that range rather than smack on a 2% handle.
5 – Gold ETFs are popular listed here and overseas however I think for wheat, pork bellies, orange juice etc you’d need to go to the US, although futures are the purest form of trading the likes of wheat and OJ.
BBOZ BetaShares ETF Chart
Question 7
“Hi Guys, first time in ages I have followed a trading alert from MM. I bought at 11.65 this not a stock I would normally buy. Could I please get what your targets from sims are and also where would you place a stop at please” – Frank M.
Hi Frank,
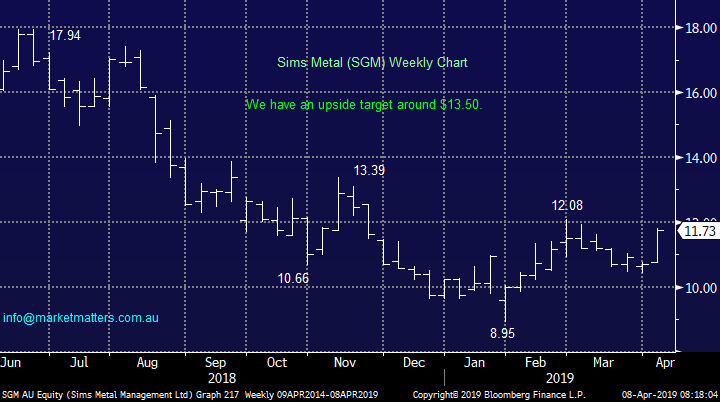
Great to see you back to following our alerts, lets hope this is a big winner. Sims have a strategy day today/tomorrow and site tour for analysts, so news flow should tic up on this stock today.
We are bullish SGM targeting $13.50 with current stops below last week’s low
Sims Metal (SGM) Chart
Question 8
“Hi, would appreciate a view whether to hold or sell on four buys I made over the last six weeks on your recommendation, CGC, GEM, NHF and PGH. Three are just in the money with dividends due, NHF is not. “ - Thanks David H.
Hi David,
Below is a quick snapshot on the 4 stocks, 3 of which we are long:
1 – Costa Group (CGC) looks ok but needs to break over $5.60 to feel “on the money”, we still plan to average any further strong decline towards $4.
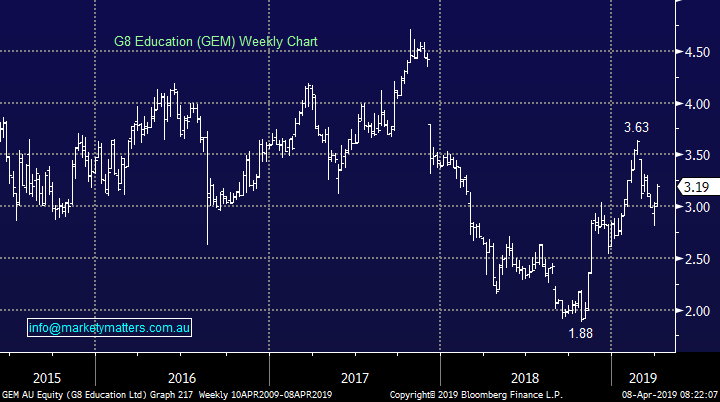
2 – G8 Education (GEM) now looks good after dipping below $3 support, we would now be running technical stops under $3.(We don’t own this one)
3 – NIB Holdings (NHF) is performing ok although I’m sure like ourselves you were happier when it was knocking on the $6 level. We remain bullish NHF.
4 – Pact Holdings (PGH) has been a volatile beast in 2019 and we caught the proverbial falling knife around current levels. We still like PGH but its not out of the woods yet.
G8 Education (GEM) Chart
Question 9
“Have you guys got a view on charter hall group? it is a high beta play on the Aussie office markets.” – Regards Andrew S.
Hi Andrew,
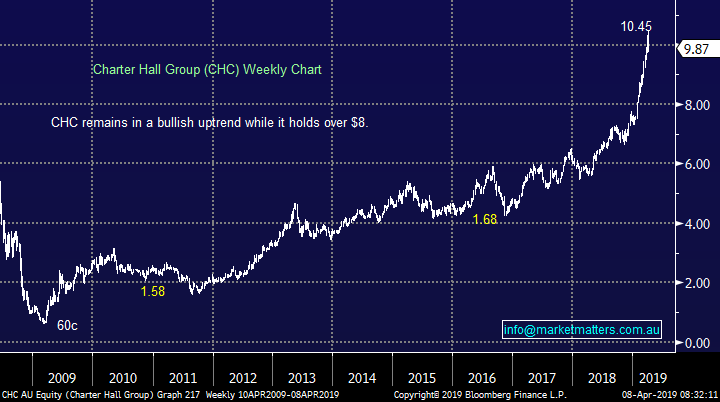
MM has discussed a few times recently our view on the REIT’s sector which we believe is coming to the end of an impressive bull market.
CHC remains in a clear uptrend and is performing strongly as a business but we are now 50-50 at best that the next 10% move is up.
MM is neutral / negative the REIT’s sector but there are no sell signals with CHC.
Charter Hall Group (CHC) Chart
Question 10
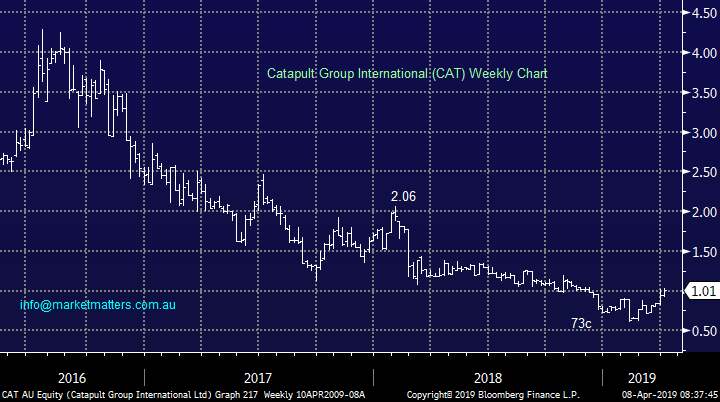
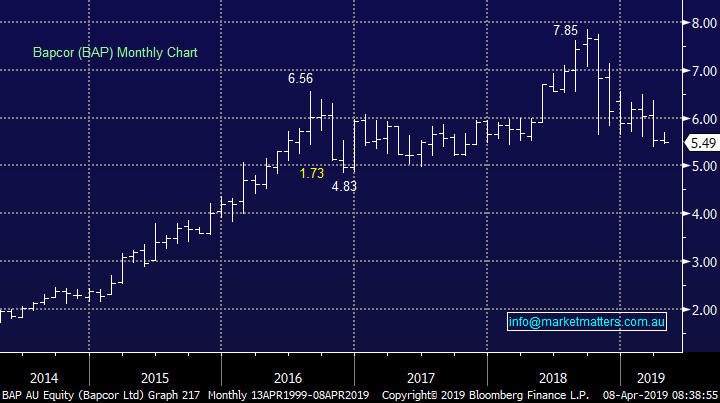
“Hi James and team, Thanks for the continued good content. I was wondering if you had any thoughts on Catapult Group International Limited (CAT) and Bapcor (BAP)” - Many thanks Greg C.
Hi Greg,
Thanks for the thumbs up, much appreciated.
1 – Sports analytics business CAT has endured an awful few years and we could only attempt to “pick a bottom” using technical methods – we could buy CAT with stops below 84c, a chunky 17% risk.
2 – Automotive parts retailer Bapcor (BAP) is close to making fresh multi-month lows. We had previously been bearish targeting the $5 region and at this stage we see no reason to alter our view.
Catapult Group International (CAT) Chart
Bapcor (BAP) Chart
Overnight Market Matters Wrap
· The US rallied last Friday, after adding 196,000 jobs in March, ahead of analyst expectations of 175,000, while unemployment rate sits at 3.8% with decent wage growth.
· US quarterly profit season kicks off this week with expectations that earnings will fall for the first time, year on year, since 2016.
· In Europe, British PM May has asked the EU to delay Brexit until June 30.
· Metals were weaker on the LME, iron ore and gold with little change while crude oil rallied to a five month high after the US jobs data.
· The March SPI Futures is indicating the ASX 200 to open 32 points higher, testing the 6215 level this morning.
Have a great day!
James & the Market Matters Team
Disclosure
Market Matters may hold stocks mentioned in this report. Subscribers can view a full list of holdings on the website by clicking here. Positions are updated each Friday, or after the session when positions are traded.
Disclaimer
All figures contained from sources believed to be accurate. Market Matters does not make any representation of warranty as to the accuracy of the figures and disclaims any liability resulting from any inaccuracy. Prices as at 08/04/2019
Reports and other documents published on this website and email (‘Reports’) are authored by Market Matters and the reports represent the views of Market Matters. The MarketMatters Report is based on technical analysis of companies, commodities and the market in general. Technical analysis focuses on interpreting charts and other data to determine what the market sentiment about a particular financial product is, or will be. Unlike fundamental analysis, it does not involve a detailed review of the company’s financial position.
The Reports contain general, as opposed to personal, advice. That means they are prepared for multiple distributions without consideration of your investment objectives, financial situation and needs (‘Personal Circumstances’). Accordingly, any advice given is not a recommendation that a particular course of action is suitable for you and the advice is therefore not to be acted on as investment advice. You must assess whether or not any advice is appropriate for your Personal Circumstances before making any investment decisions. You can either make this assessment yourself, or if you require a personal recommendation, you can seek the assistance of a financial advisor. Market Matters or its author(s) accepts no responsibility for any losses or damages resulting from decisions made from or because of information within this publication. Investing and trading in financial products are always risky, so you should do your own research before buying or selling a financial product.
The Reports are published by Market Matters in good faith based on the facts known to it at the time of their preparation and do not purport to contain all relevant information with respect to the financial products to which they relate. Although the Reports are based on information obtained from sources believed to be reliable, Market Matters does not make any representation or warranty that they are accurate, complete or up to date and Market Matters accepts no obligation to correct or update the information or opinions in the Reports. Market Matters may publish content sourced from external content providers.
If you rely on a Report, you do so at your own risk. Past performance is not an indication of future performance. Any projections are estimates only and may not be realised in the future. Except to the extent that liability under any law cannot be excluded, Market Matters disclaims liability for all loss or damage arising as a result of any opinion, advice, recommendation, representation or information expressly or impliedly published in or in relation to this report notwithstanding any error or omission including negligence.


