What a difference an election makes, what now? (NHF, WBC, NAB, EHL, WEB, TCG LN, SYD)
What a difference an election makes, what now?
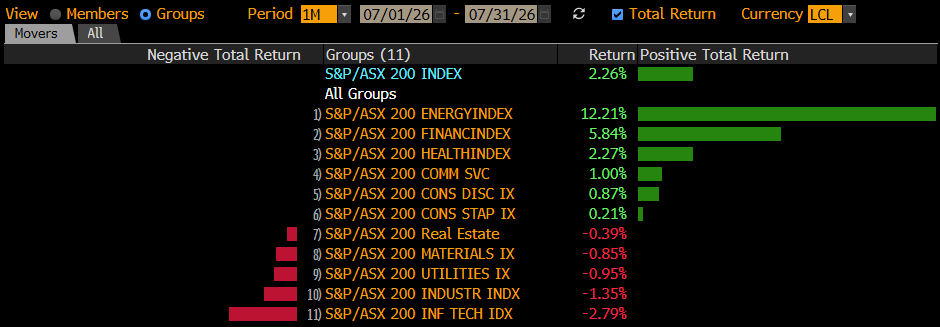
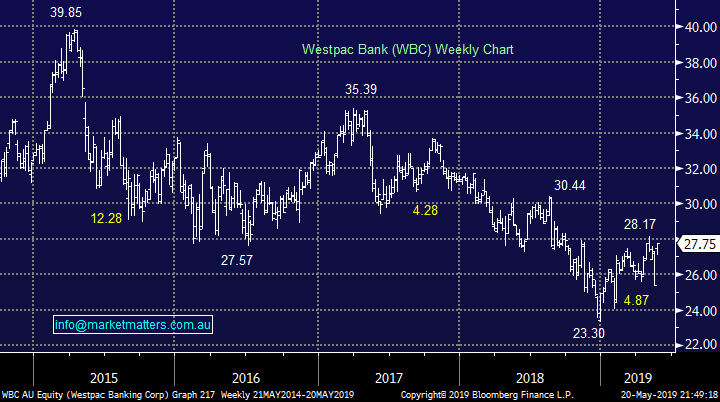
The ASX200 literally went through the roof yesterday courtesy of the banking sector which single handily added ~90-points to the ASX200 index - the market was clearly positioned for a Labor victory and that pressure valve on the banks was clearly released with some force. The statistics were tested in all the right ways during this post-election “relief rally” with Westpac (WBC) who gained over 9% enjoying its best day since the hedonistic 1980’s. We don’t believe the tailwinds enjoyed by the banks during this huge election relief rally are likely to vanish in just a single days euphoric “pop”:
1 – Term deposits are basically paying between 2% and 2.5% while hot stock WBC is still yielding 6.8% fully franked, growth or not, that remains an attractive return to many.
2 – Under the Liberal government we have probably seen the vortex of banking regulations & compliance costs, clearly a relief to the sector moving forward.
3 – Fund managers appear to be significantly underweight the Australian banking sector, its easy to imagine a few being forced to join the buyers and as importantly the selling is likely to be far more absent.
4 – The “Big Four” banks were not aggressively shorted but interestingly Westpac (WBC) had the largest short position at 2.45% and that short position had grown leading into the election - not surprisingly it was the best performing bank surging +9.2%. Yesterday we saw 33m WBC shares exchange hands so if every share purchased was short-covering there still should be another 2-3days buying remaining implying any dips will be bought short-term.
The remaining bears should remember the post-election statistic we quoted yesterday - following the last 6 elections won by the Liberal Coalition the ASX200 has rallied on average well over +4% during the next 3-months, this positive correlation is no major surprise considering the combination of the parties pro-business policies and the simple end to uncertainty. The target extrapolates to the 6600 area, only 2% higher, not a bad thought for a market already up nearly 15% in calendar 2019.
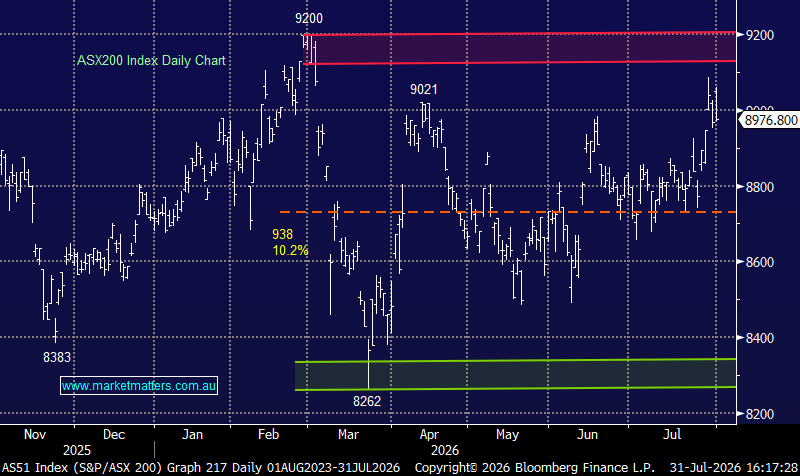
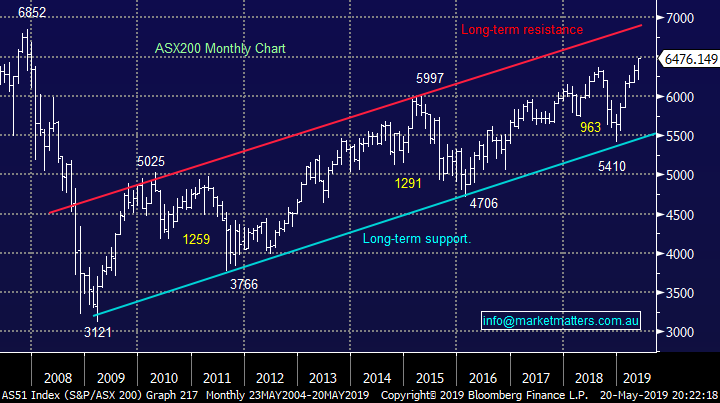
MM is bullish the ASX200 technically while the index can hold above 6350.
Overnight US stocks struggled as concerns around US – China trade deepen, the SPI is calling the ASX200 to open down 40-points giving back around 1/3 of yesterday’s advance, BHP closed down ~1% in the US which imp[lies the resources will be a drag today.
In today’s report we have looked at 5 big movers from yesterday to evaluate whether we should lock in some profits, add to positions and / or buy some stragglers in hope of catch up.
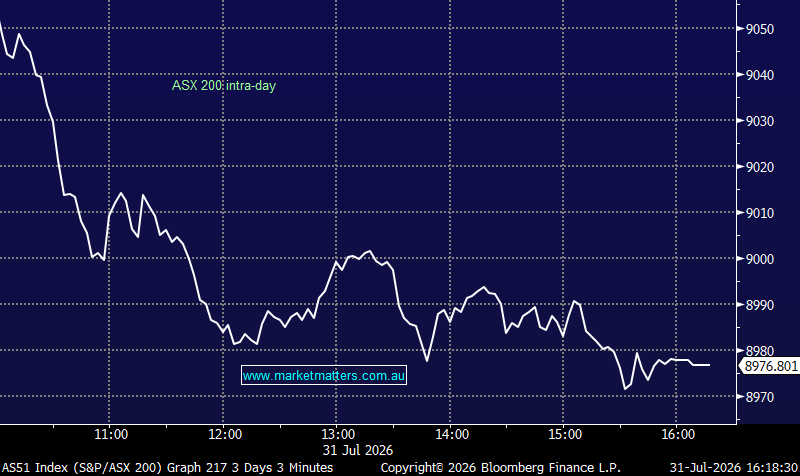
ASX200 Chart
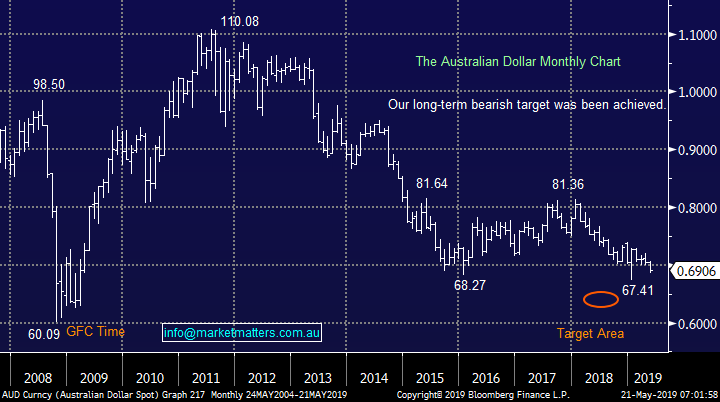
At MM we have been discussing the $A for most of the year and our prognosis has not changed, we are bullish medium-term, a clear contrarian view as we anticipate a major inflection point.
However in the short-term we have been debating whether the panic low in January down towards 67c was it, or whether would we see another attempt a fresh decade lows. At this stage especially following yesterday’s lacklustre post-election bounce were still leaning towards a break to fresh multiyear lows.
MM still believes the $A will see 80c before 60c but a break to fresh 2019 lows remains very likely.
The Australian Dollar ($A) Chart
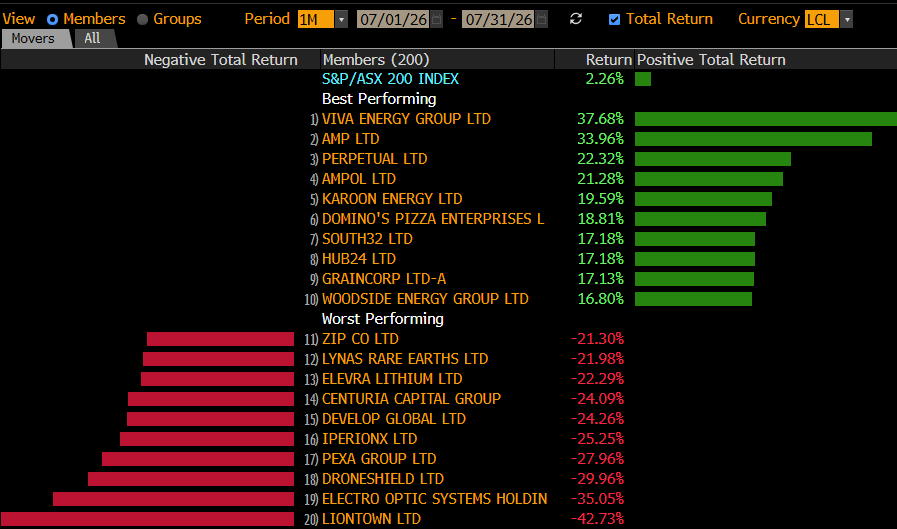
Considering 5 big movers in yesterday’s 110-point surge.
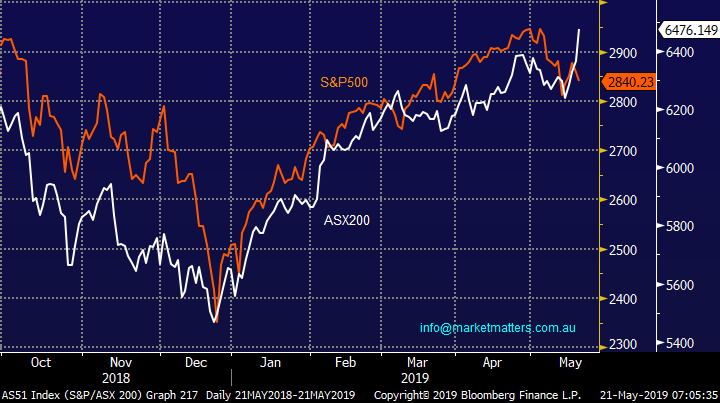
The chart below illustrates very clearly that the ASX200 will not ignore a struggling US market for too long but fortunately we still expect the S&P500 to test the 3000 area, albeit after a few % lower first as the Trump inspired volatility remains in play.
Hence todays price action on the local market will be fascinating in the face of a struggling US market, my “Gut Feel” is banks hold firm but resources drag the market lower.
ASX200 v US S&P500 Chart
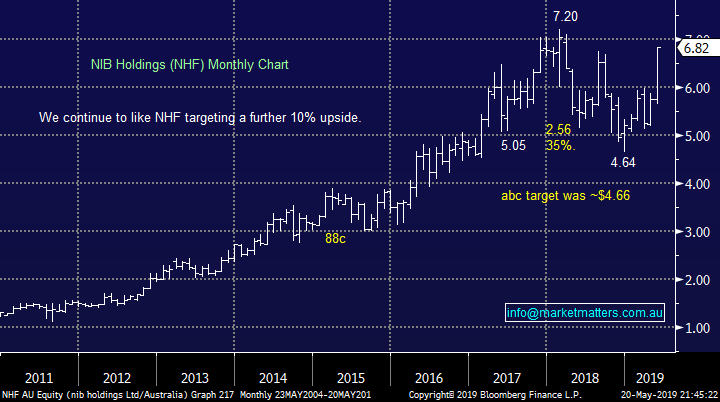
1 NIB Holdings (NHF) $6.82
Both NIB Holdings (NHF) and Medibank (MPL) surged yesterday taking out to top two spots on the ASX200, no mean feat when the market itself rallied 110-points / 1.7%. The health insurers are revelling in the fact that Labors proposed cap of 2% on premium increases is now a thing of the past and its likely to be back to normal business i.e. recent increase have been over 3%.
The other aspect supporting NHF’s pop yesterday is the negative positioning of the market towards the insurer. The most bullish bulge bracket broker we see is JP Morgan with a TP of $5.71. This means the market is probably very underweight the stock, hence the move.
The technical picture for NHF is excellent targeting another 10% upside to add to yesterday’s +15.8% ripper day.
MM remains bullish NHF targeting the $7.50 area.
NIB Holdings (NHF) Chart
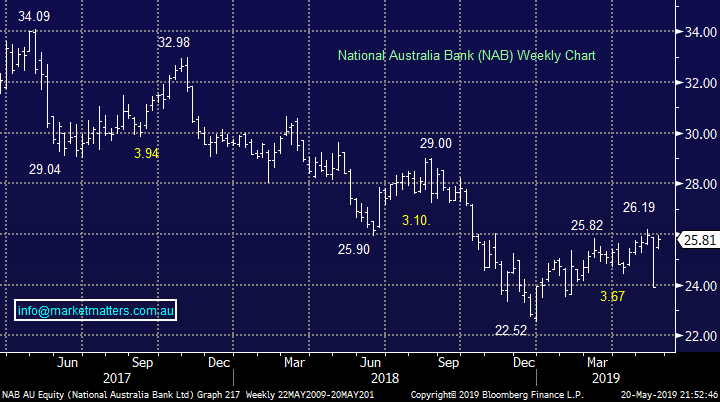
2 Westpac Bank (WBC) $27.75 & the banks
As previously mentioned the Financial Sector enjoyed a memorable start to the week rallying a combined +5.9% but its was really all about the hugely influential “Big Four” who surged between +6.3% and +9.2%.
At this stage for the reasons mentioned earlier we intend to hold onto our overweight sector position as the market doesn’t feel stretched enough yet to consider taking some $$ from the table – the “path of most pain” still feels up.
MM feels the bank have further to run / outperform.
Westpac (WBC) Chart
National Australia Bank (NAB) Chart
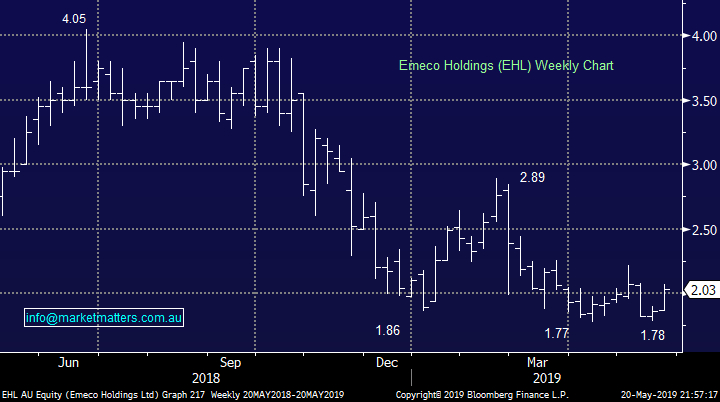
3 Emeco Holdings (EHL) $2.03
EHL surged over +9% basically rallying steadily all day as opposed to opening with a bang like much of the index. There was no clear reason behind the advance which arguably adds more value to its existence and some positive news would not surprise in the days / weeks ahead.
MM remains bullish EHL with a target above $2.50.
Emeco Holdings (EHL) Chart
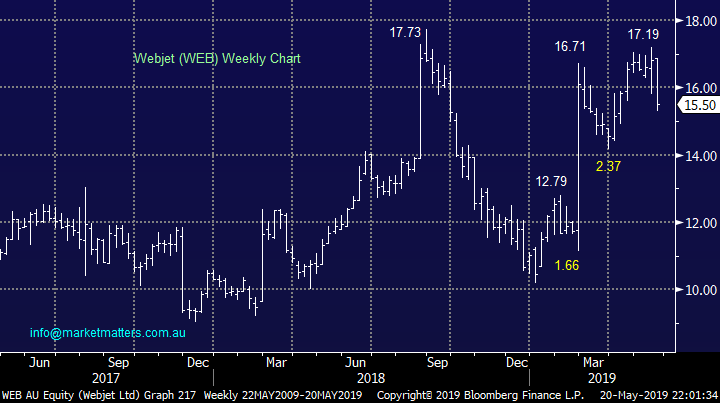
4 Webjet (WEB) $15.50
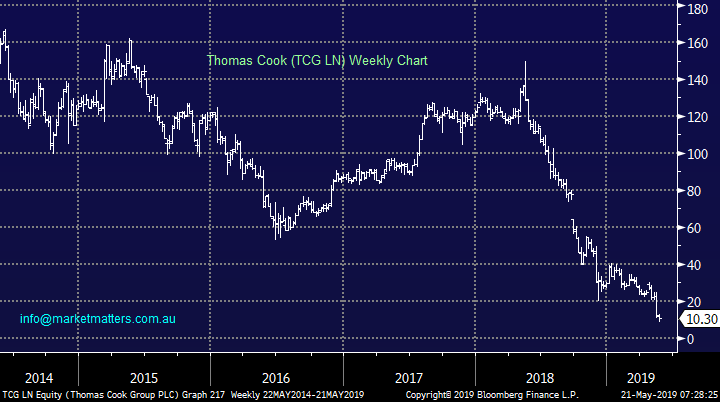
The worst performing honours for yesterday’s memorable session went to on-line travel agent Webjet (WEB) which fell almost 8% on concerns for its strategic partner Thomas Cook (TCG) in the UK. Shares in TCG had plummeted 40% as worries around its underlying viability – it fell another 10% last night.
MM is short-term bearish WEB targeting between 5% and 10% further downside.
Webjet (WEB) Chart
Thomas Cook (TCG LN) Chart
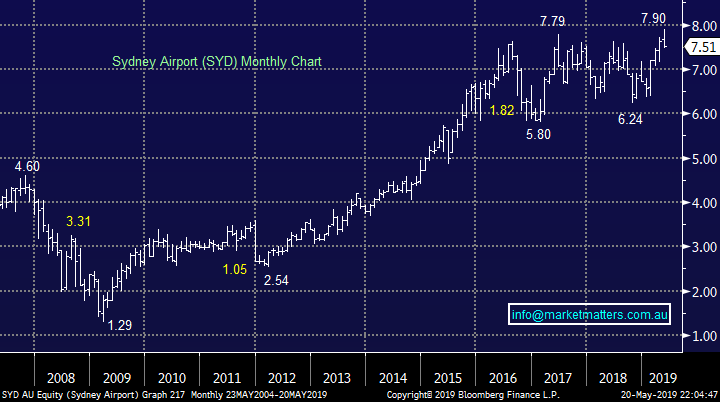
5 Sydney Airports (SYD) $7.51
SYD slipped all day to close down almost 4% yesterday as the competition for yield switched towards the higher yielding banks i.e. SYD now yields under 5% unfranked compared to conservative bank CBA of 7.95% inclusive of franking.
While it’s hard to become bearish on SYD when interest rates are low, we would expect that at least some of the recent ~20% advance to be given back.
MM is neutral SYD.
Sydney Airport (SYD) Chart
Conclusion (s)
Of the 5 stocks / sectors we considered today the theme is very cliché “let the winners run and cut the losses”, at this stage we want the elastic band to stretch further before we take some $$ out of our banks and consider the post-election underperformers, in particular the resources.
Global Indices
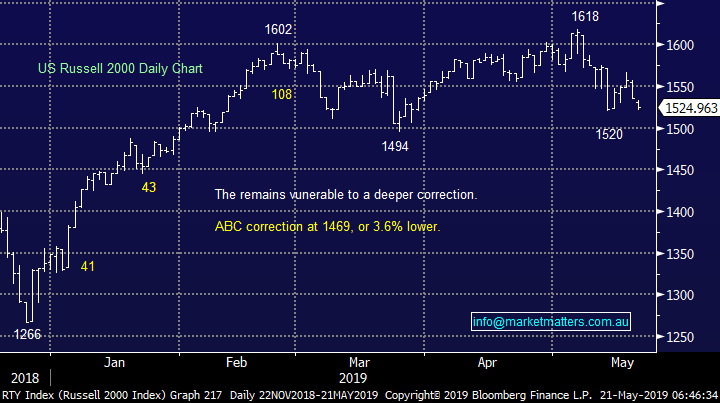
US stocks slipped lower last night with the tech based NASDAQ the worst performer -1.7% as trade talks concern the sector, MM’s target for this correction for the often leading Russell 2000 is ~3.6% lower.
US stocks continue to feel like it’s time to be accumulating for a final push higher.
US Russell 2000 (small cap) Index Chart
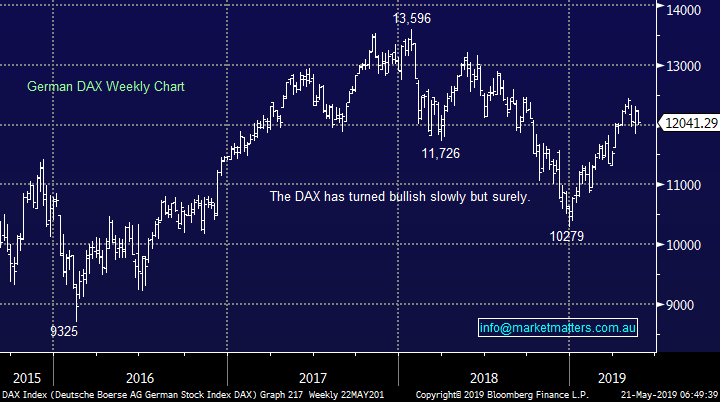
No change with European indices, we remain cautious as we’re in the “sell in May and go away” period for European stocks but the tone is improving fast.
German DAX Chart
Overnight Market Matters Wrap
· The US equity markets continued to decline, led by the tech. heavy Nasdaq 100, off 1.69% following assumed consequences on the US-China trade war. Currently US against Huawaei could be retaliated with China banning Apple products.
· Iron Ore lost ground overnight, and we expect BHP to continue its decline for the week and underperform the broader market after ending its US session down an equivalent of -0.93% from Australia’s previous close.
· The June SPI Futures is indicating the ASX 200 to give back some of yesterday’s gains and lose 38 points towards the 6435 level this morning.
Have a great day!
James & the Market Matters Team
Disclosure
Market Matters may hold stocks mentioned in this report. Subscribers can view a full list of holdings on the website by clicking here. Positions are updated each Friday, or after the session when positions are traded.
Disclaimer
All figures contained from sources believed to be accurate. Market Matters does not make any representation of warranty as to the accuracy of the figures and disclaims any liability resulting from any inaccuracy. Prices as at 21/05/2019
Reports and other documents published on this website and email (‘Reports’) are authored by Market Matters and the reports represent the views of Market Matters. The MarketMatters Report is based on technical analysis of companies, commodities and the market in general. Technical analysis focuses on interpreting charts and other data to determine what the market sentiment about a particular financial product is, or will be. Unlike fundamental analysis, it does not involve a detailed review of the company’s financial position.
The Reports contain general, as opposed to personal, advice. That means they are prepared for multiple distributions without consideration of your investment objectives, financial situation and needs (‘Personal Circumstances’). Accordingly, any advice given is not a recommendation that a particular course of action is suitable for you and the advice is therefore not to be acted on as investment advice. You must assess whether or not any advice is appropriate for your Personal Circumstances before making any investment decisions. You can either make this assessment yourself, or if you require a personal recommendation, you can seek the assistance of a financial advisor. Market Matters or its author(s) accepts no responsibility for any losses or damages resulting from decisions made from or because of information within this publication. Investing and trading in financial products are always risky, so you should do your own research before buying or selling a financial product.
The Reports are published by Market Matters in good faith based on the facts known to it at the time of their preparation and do not purport to contain all relevant information with respect to the financial products to which they relate. Although the Reports are based on information obtained from sources believed to be reliable, Market Matters does not make any representation or warranty that they are accurate, complete or up to date and Market Matters accepts no obligation to correct or update the information or opinions in the Reports. Market Matters may publish content sourced from external content providers.
If you rely on a Report, you do so at your own risk. Past performance is not an indication of future performance. Any projections are estimates only and may not be realised in the future. Except to the extent that liability under any law cannot be excluded, Market Matters disclaims liability for all loss or damage arising as a result of any opinion, advice, recommendation, representation or information expressly or impliedly published in or in relation to this report not withstanding any error or omission including negligence.